


A Substack bestseller, Italy with Antonio offers honest guides for moving to, traveling in, and understanding Italy from a native Italian. Three articles a week, with deeper resources for paid members (including the print-ready PDF and ePub downloads of this article). Join over 2,000 subscribers!
Apparently, I can’t stay away from Istat data when I can’t sleep at night. Most recently, I mapped happiness in Italy. Today we talk about immigrants. So this is essentially becoming a series. Subscribe so you don’t miss it.
Many people want to move to Italy, and each year hundreds of thousands succeed. So I got curious about where, exactly, they end up in Italy. This article, which is really a collection of maps I generated, shows you where.
Where the foreign-born live in Italy
When journalists report immigration data about Italy, they mostly throw around the 5.4 million foreign citizens figure. 9.1% of the country. It’s not an incorrect number, but it undersells the real extent of immigration in Italy.
In fact, Istat stops counting foreign citizens the moment they acquire Italian citizenship. So if a 37-year-old Romanian plumber moves to Rome and after a few years becomes Italian, he stops being counted. I’ve been in Canada for 20 years and hold Canadian citizenship, but I’m very much still an immigrant in Canada, as I was born and raised in Italy and moved here at 26.
A better approach to measuring the real number of immigrants is counting how many people living in Italy were born outside of it. It turns out, as of January 1st, 2025, it’s 6,928,045 people. Just shy of 7 million people. 11.8% of the population.
The gap between 6.9 million and 5.4 million comes down to immigrants disappearing from the statistics the moment they naturalize as Italians.
All the maps below are at comune (municipality) level, with data from all 7,896 of them.
Let’s start with the overall picture. The map below draws a single dot per 250 foreign residents. Gray areas with no dots represent territory with fewer than 126 foreign-born residents.
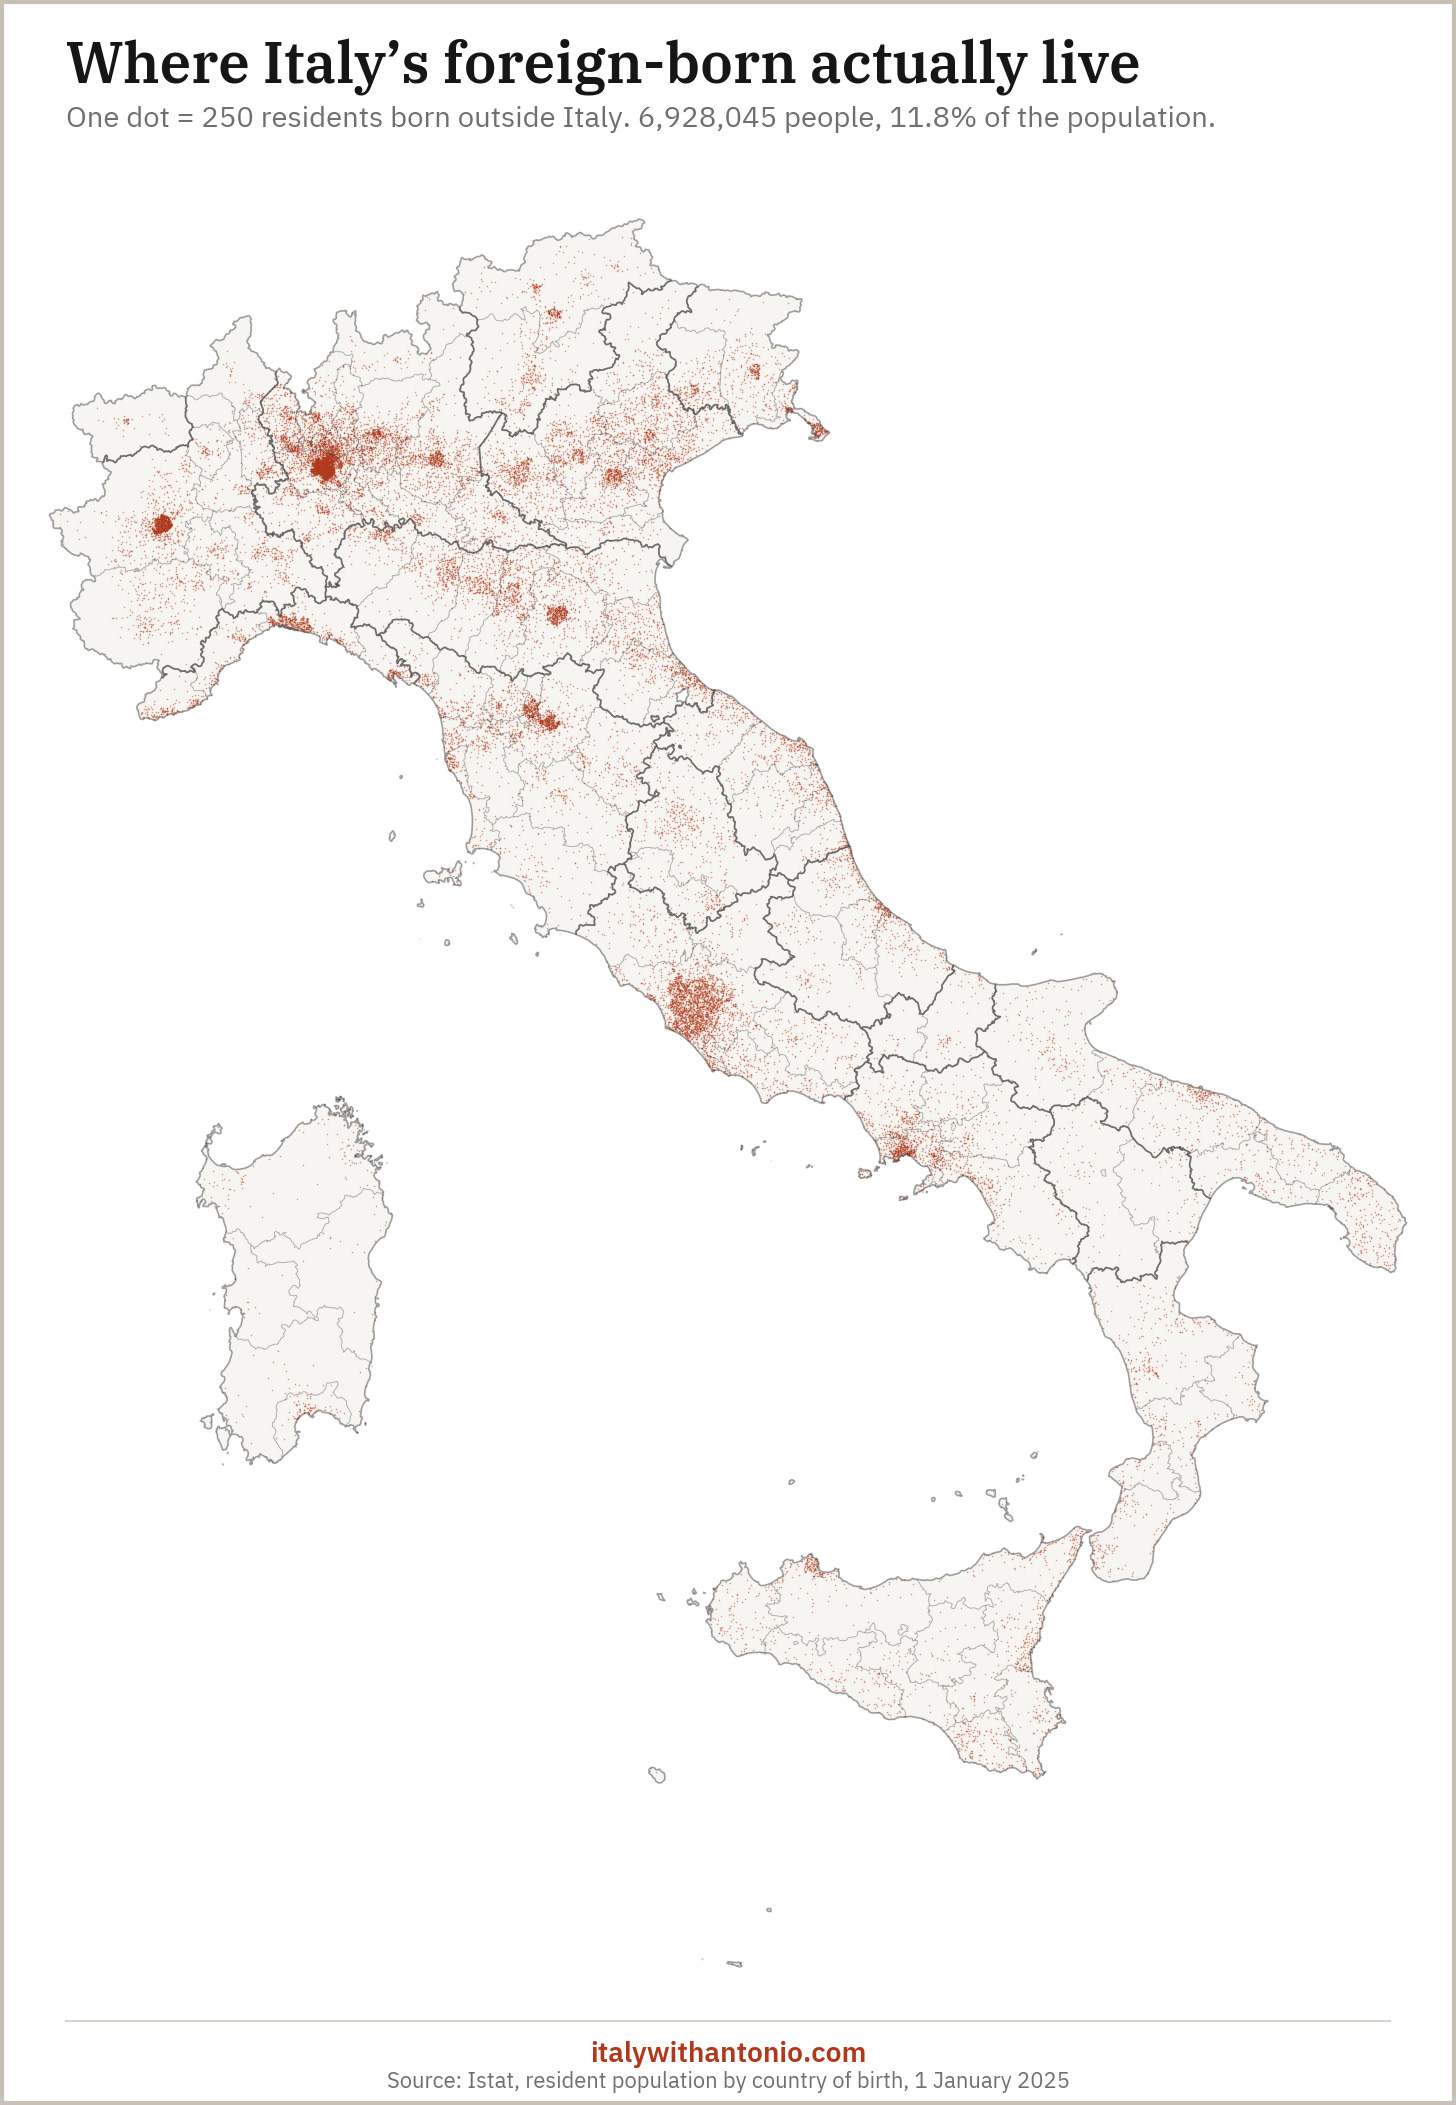
As you can see, foreign-born residents tend to cluster in Rome and Florence, as well as major cities of the north, including Bologna, Milan, and Turin. The Adriatic coast is also well represented.
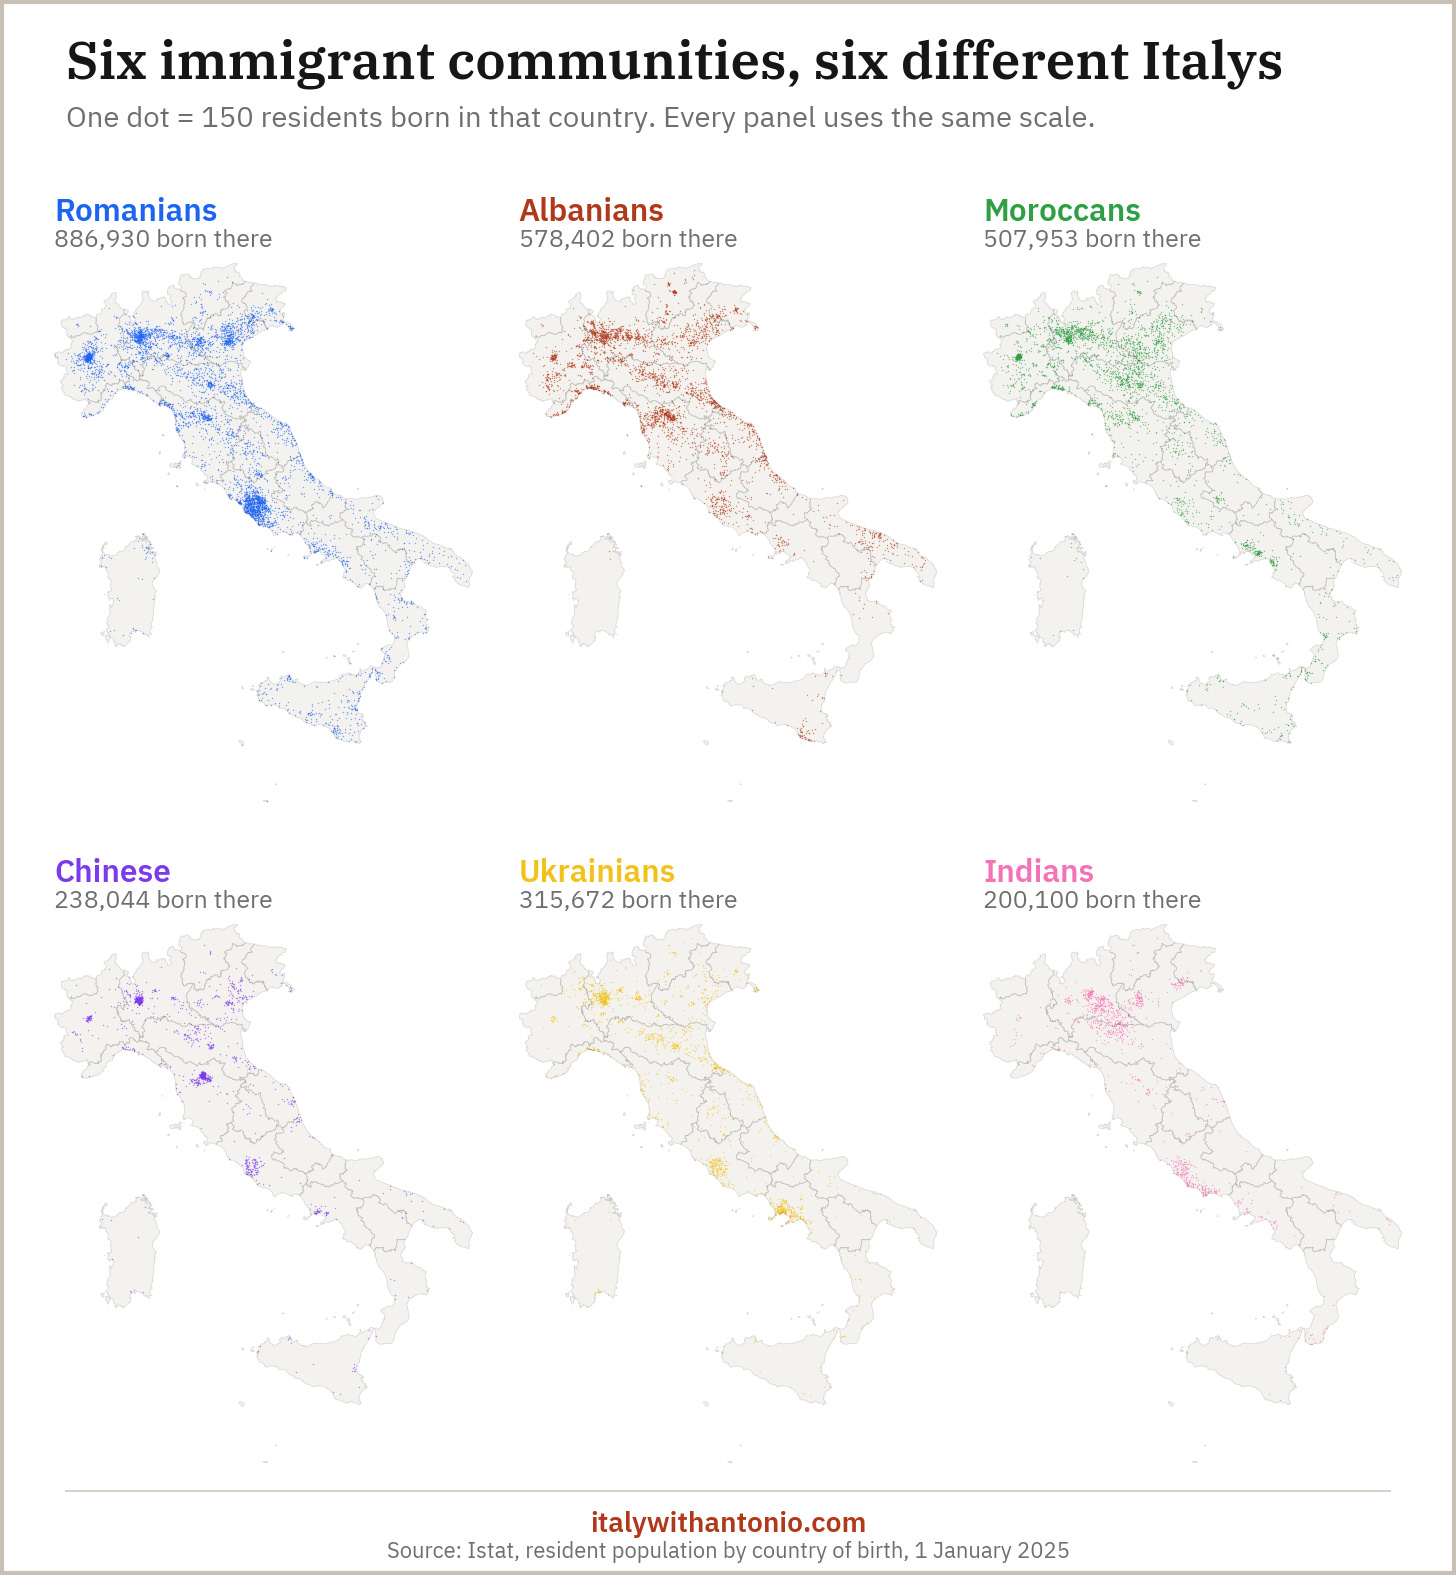
Next, let’s divide the map into country-of-origin-specific submaps, using six large communities that are often mentioned when discussing immigration in Italy. The general pattern holds, but you can clearly see differences between nationalities.
Romanians like Rome far more than Moroccans do. Albanians have several foci in Italy, but they love the Adriatic coast (understandably) more than anyone else. The Ukrainians choose Naples surprisingly often.
The Chinese cluster in Tuscany is not Florence, by the way. It’s Prato. The Chinese, for the most part, have moved to Milan and Prato.
So far, we’ve dealt in absolute numbers. A dot gave you 250 foreign-born residents (or 150 for nationality-specific maps). That’s useful, but it falls a bit short because a large city could have a relatively small foreign population percentage-wise, yet the sheer number would still produce a cluster of many dots.
To have the full picture, let’s take a different angle: the percentage of residents born abroad. As I said, the national average is 11.8%. So in the map below, you’ll see anything below that number as a light shade of blue, and anything above in darker shades.
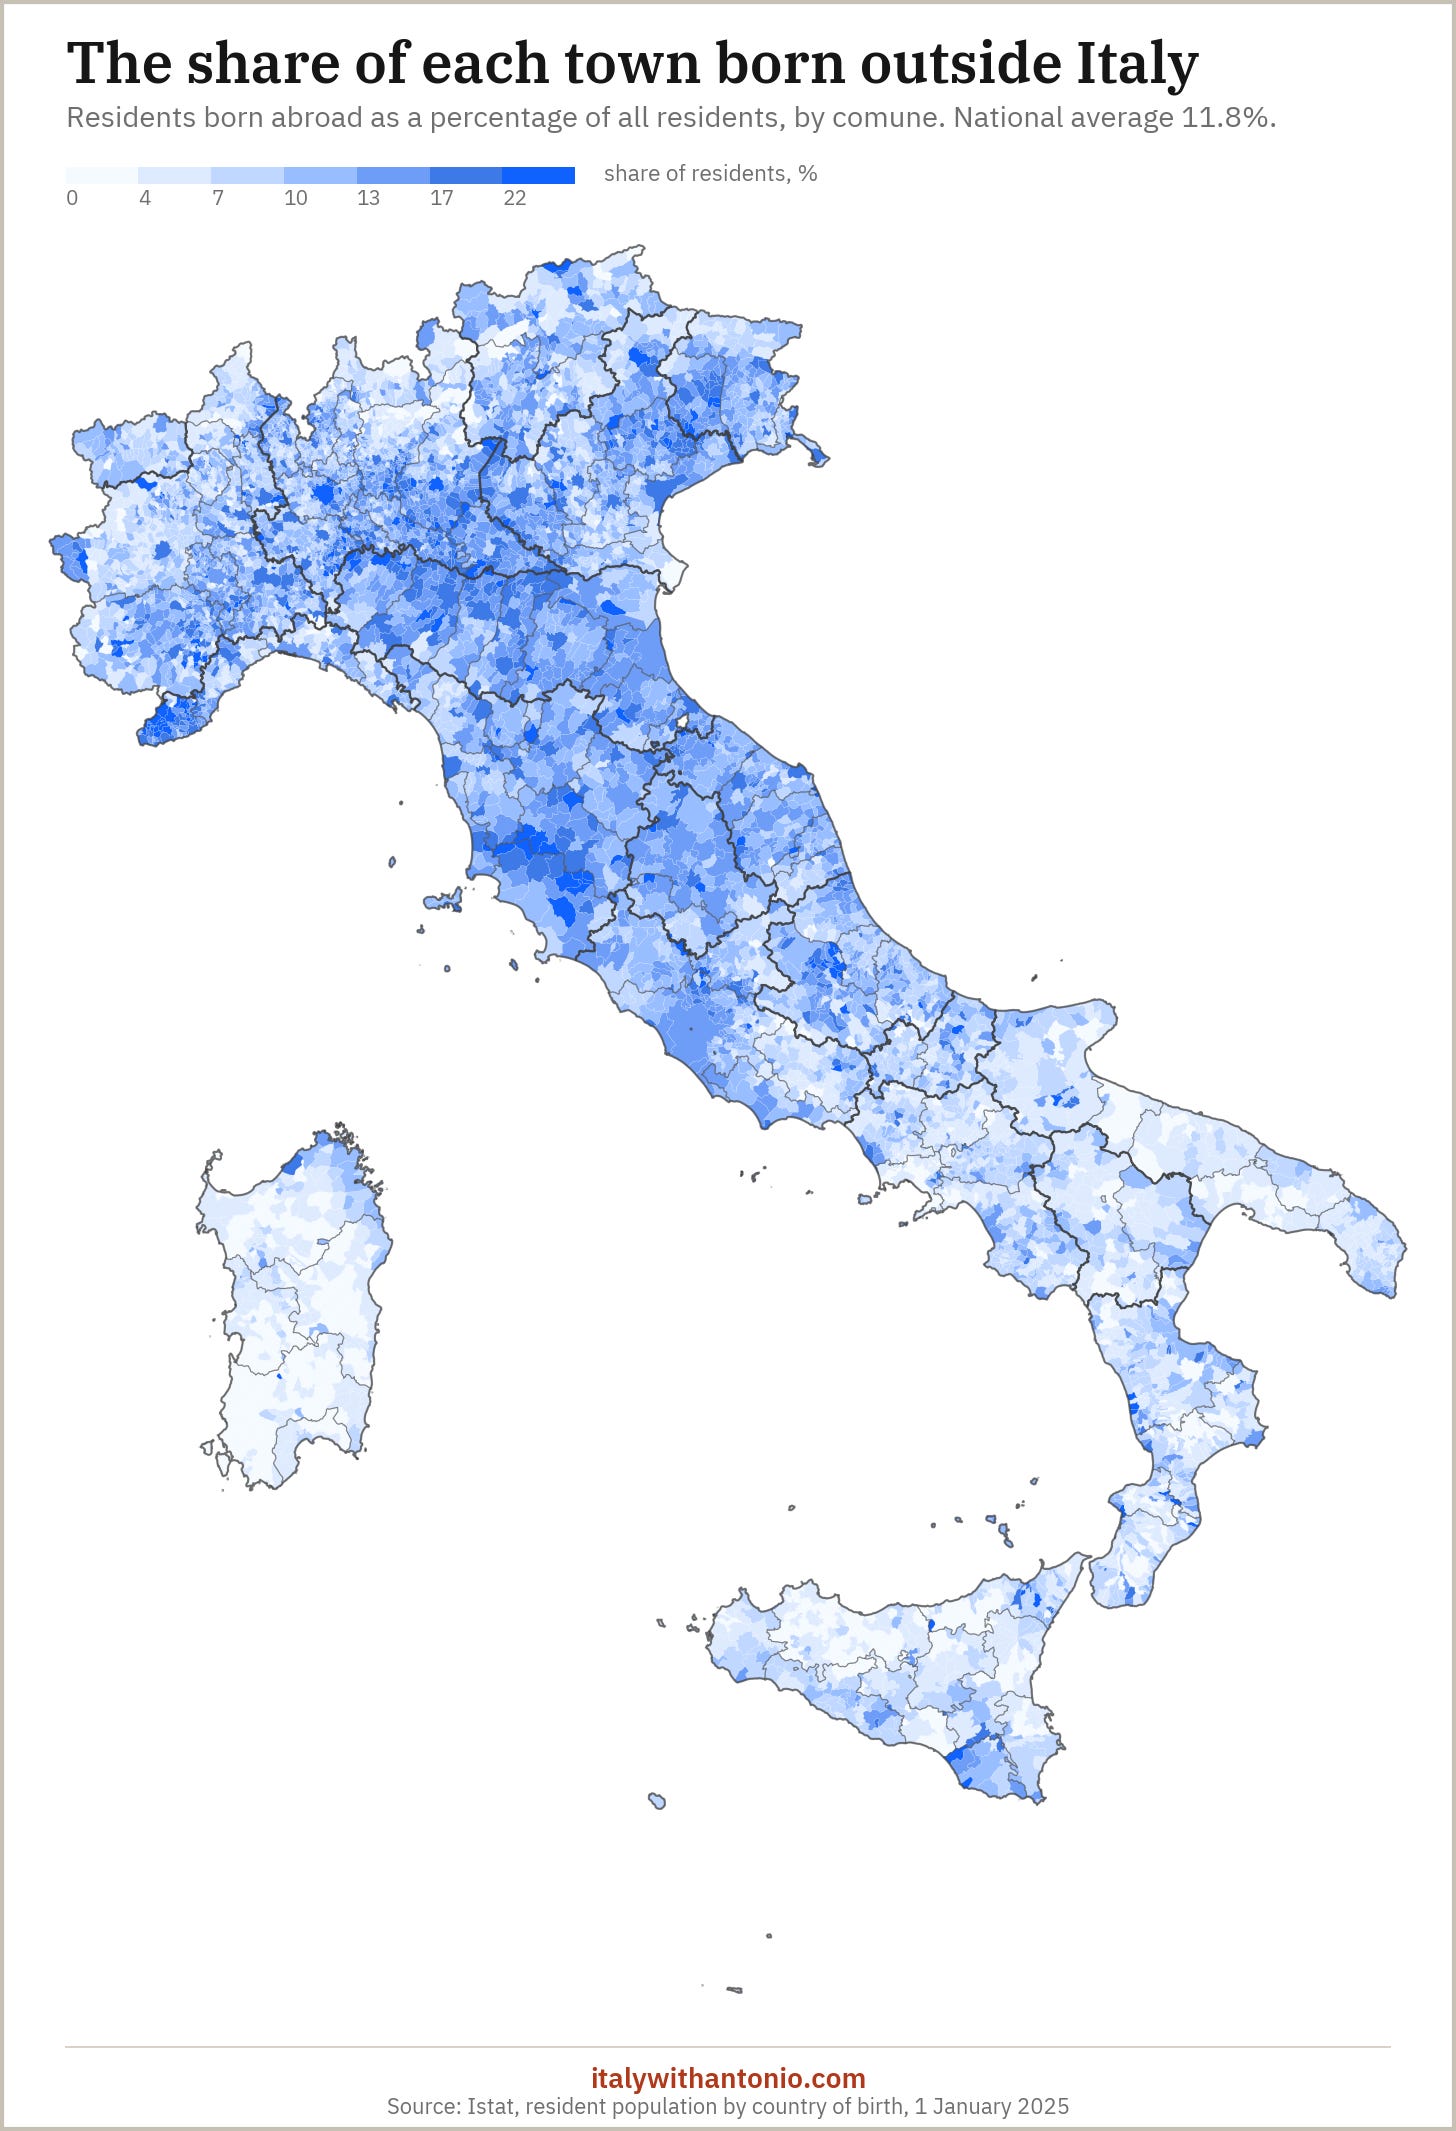
This still shows the huge gap between north and south. Immigrants overwhelmingly favor the north, where the jobs are. But it puts things in perspective, showing a less dramatic split than the headcount map, where the south was mostly empty.
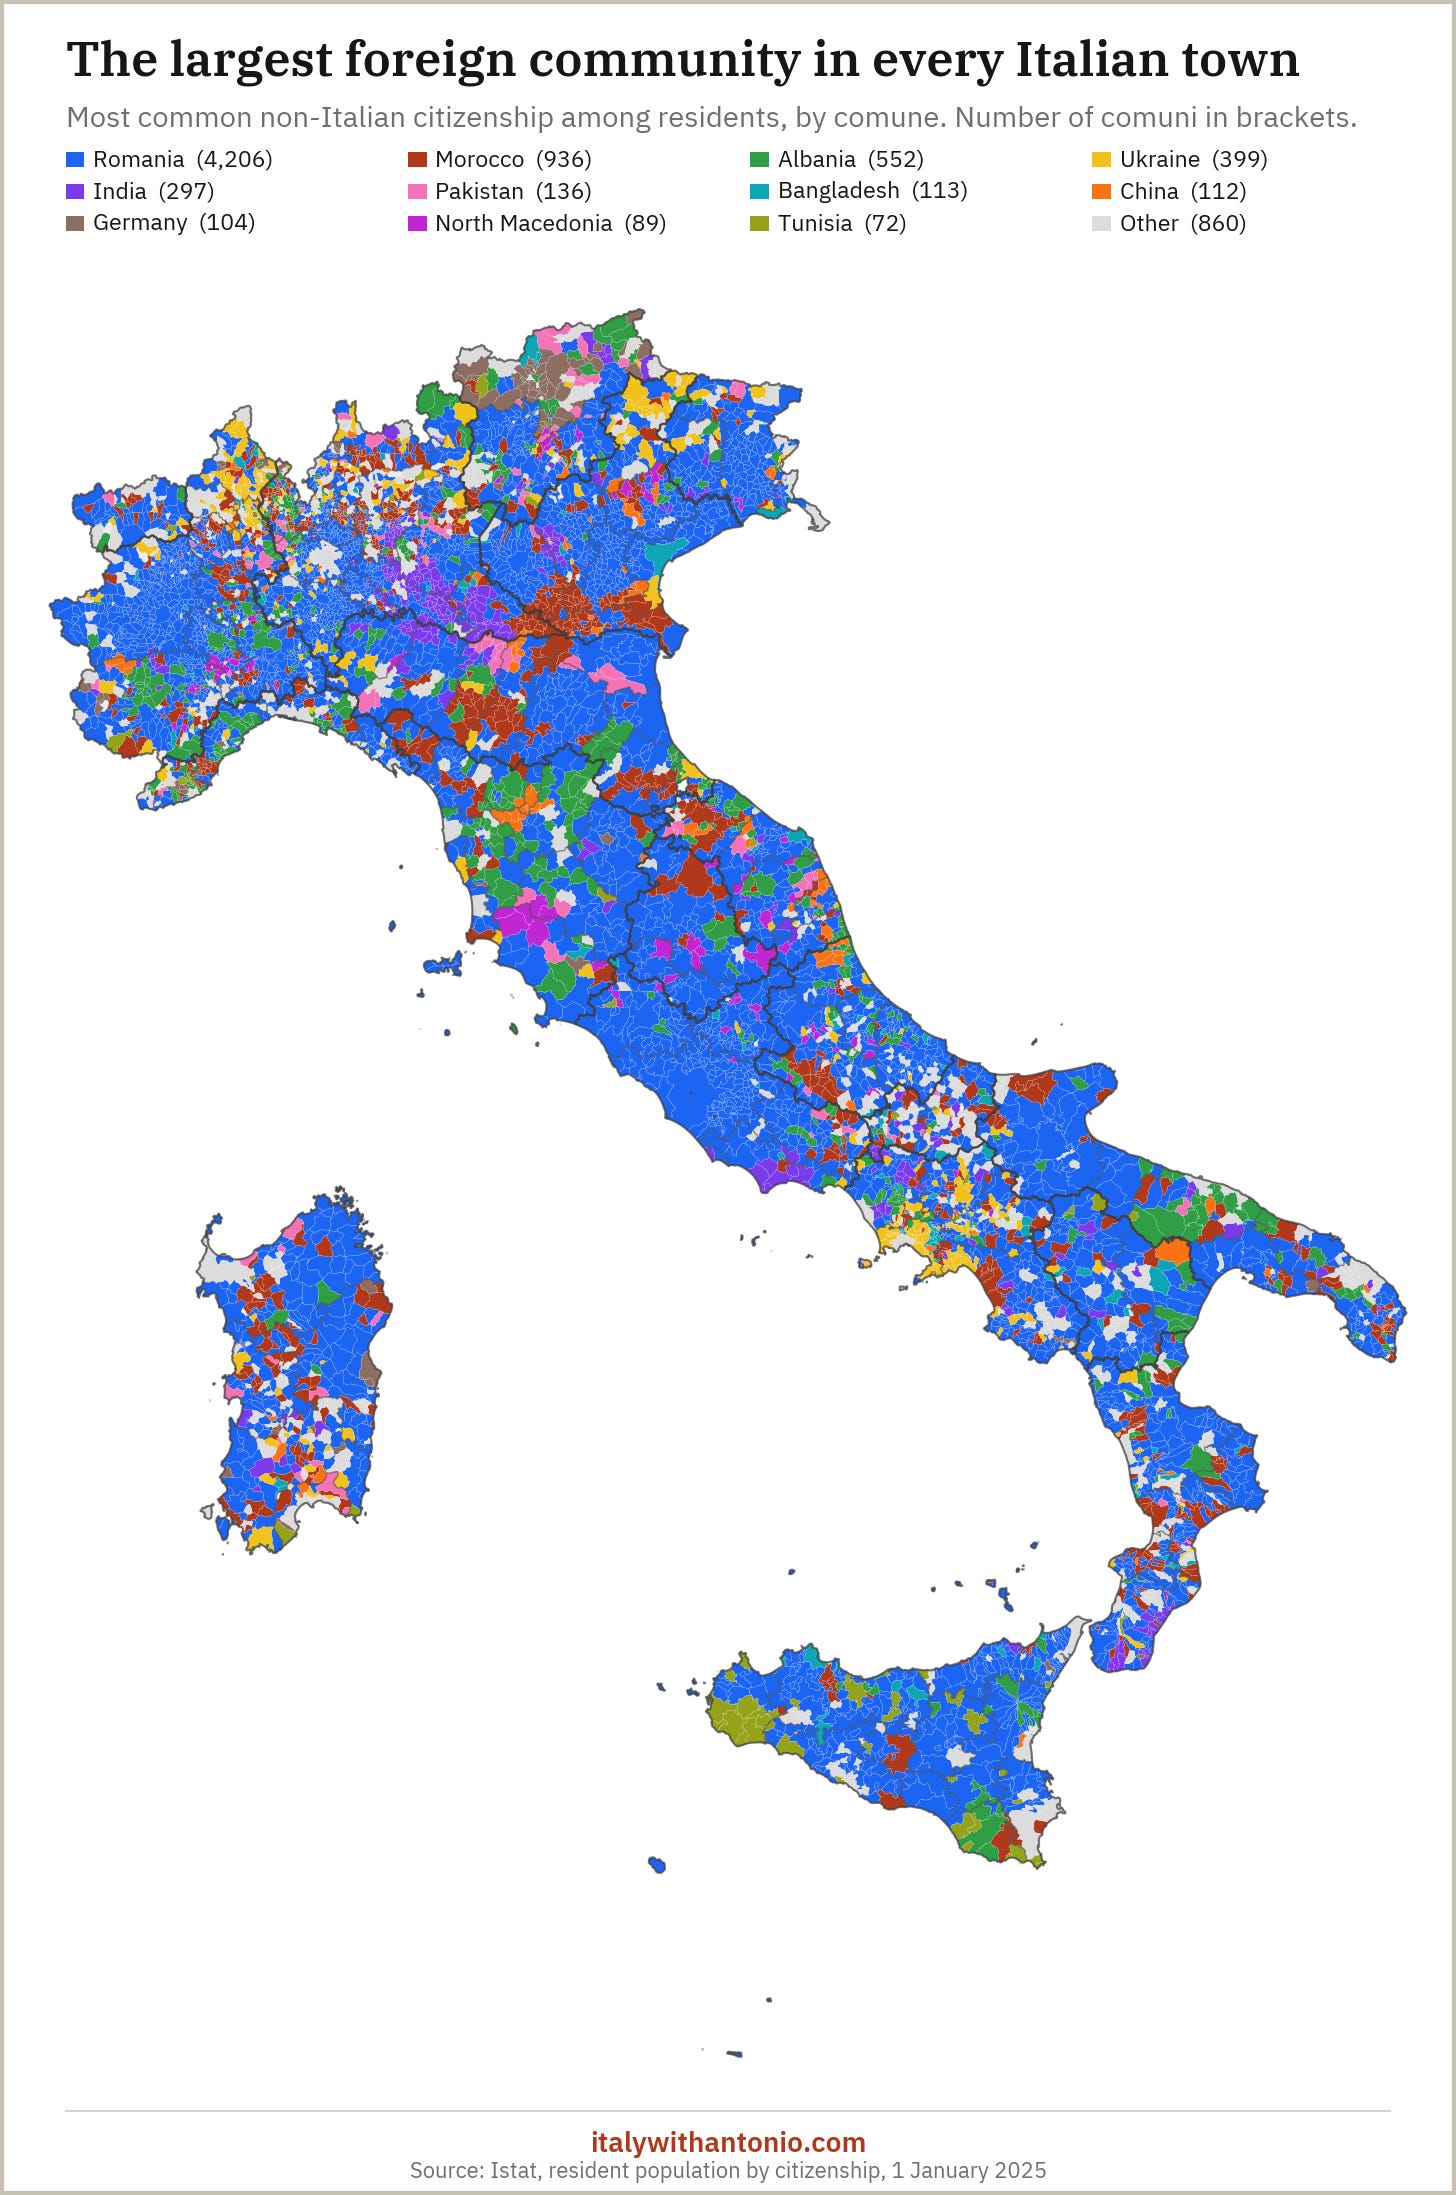
Finally, we have the map of which non-Italian citizenship is most prominent in each comune. Notice again how the Chinese dominate Prato and the Ukrainians dominate Naples. Romania dominates in more than half the Italian comuni.
Where Romanians live in Italy
Speaking of Romanians, let’s take a closer look at where they tend to live in Italy. The national average for Romanians alone is 1.50%.
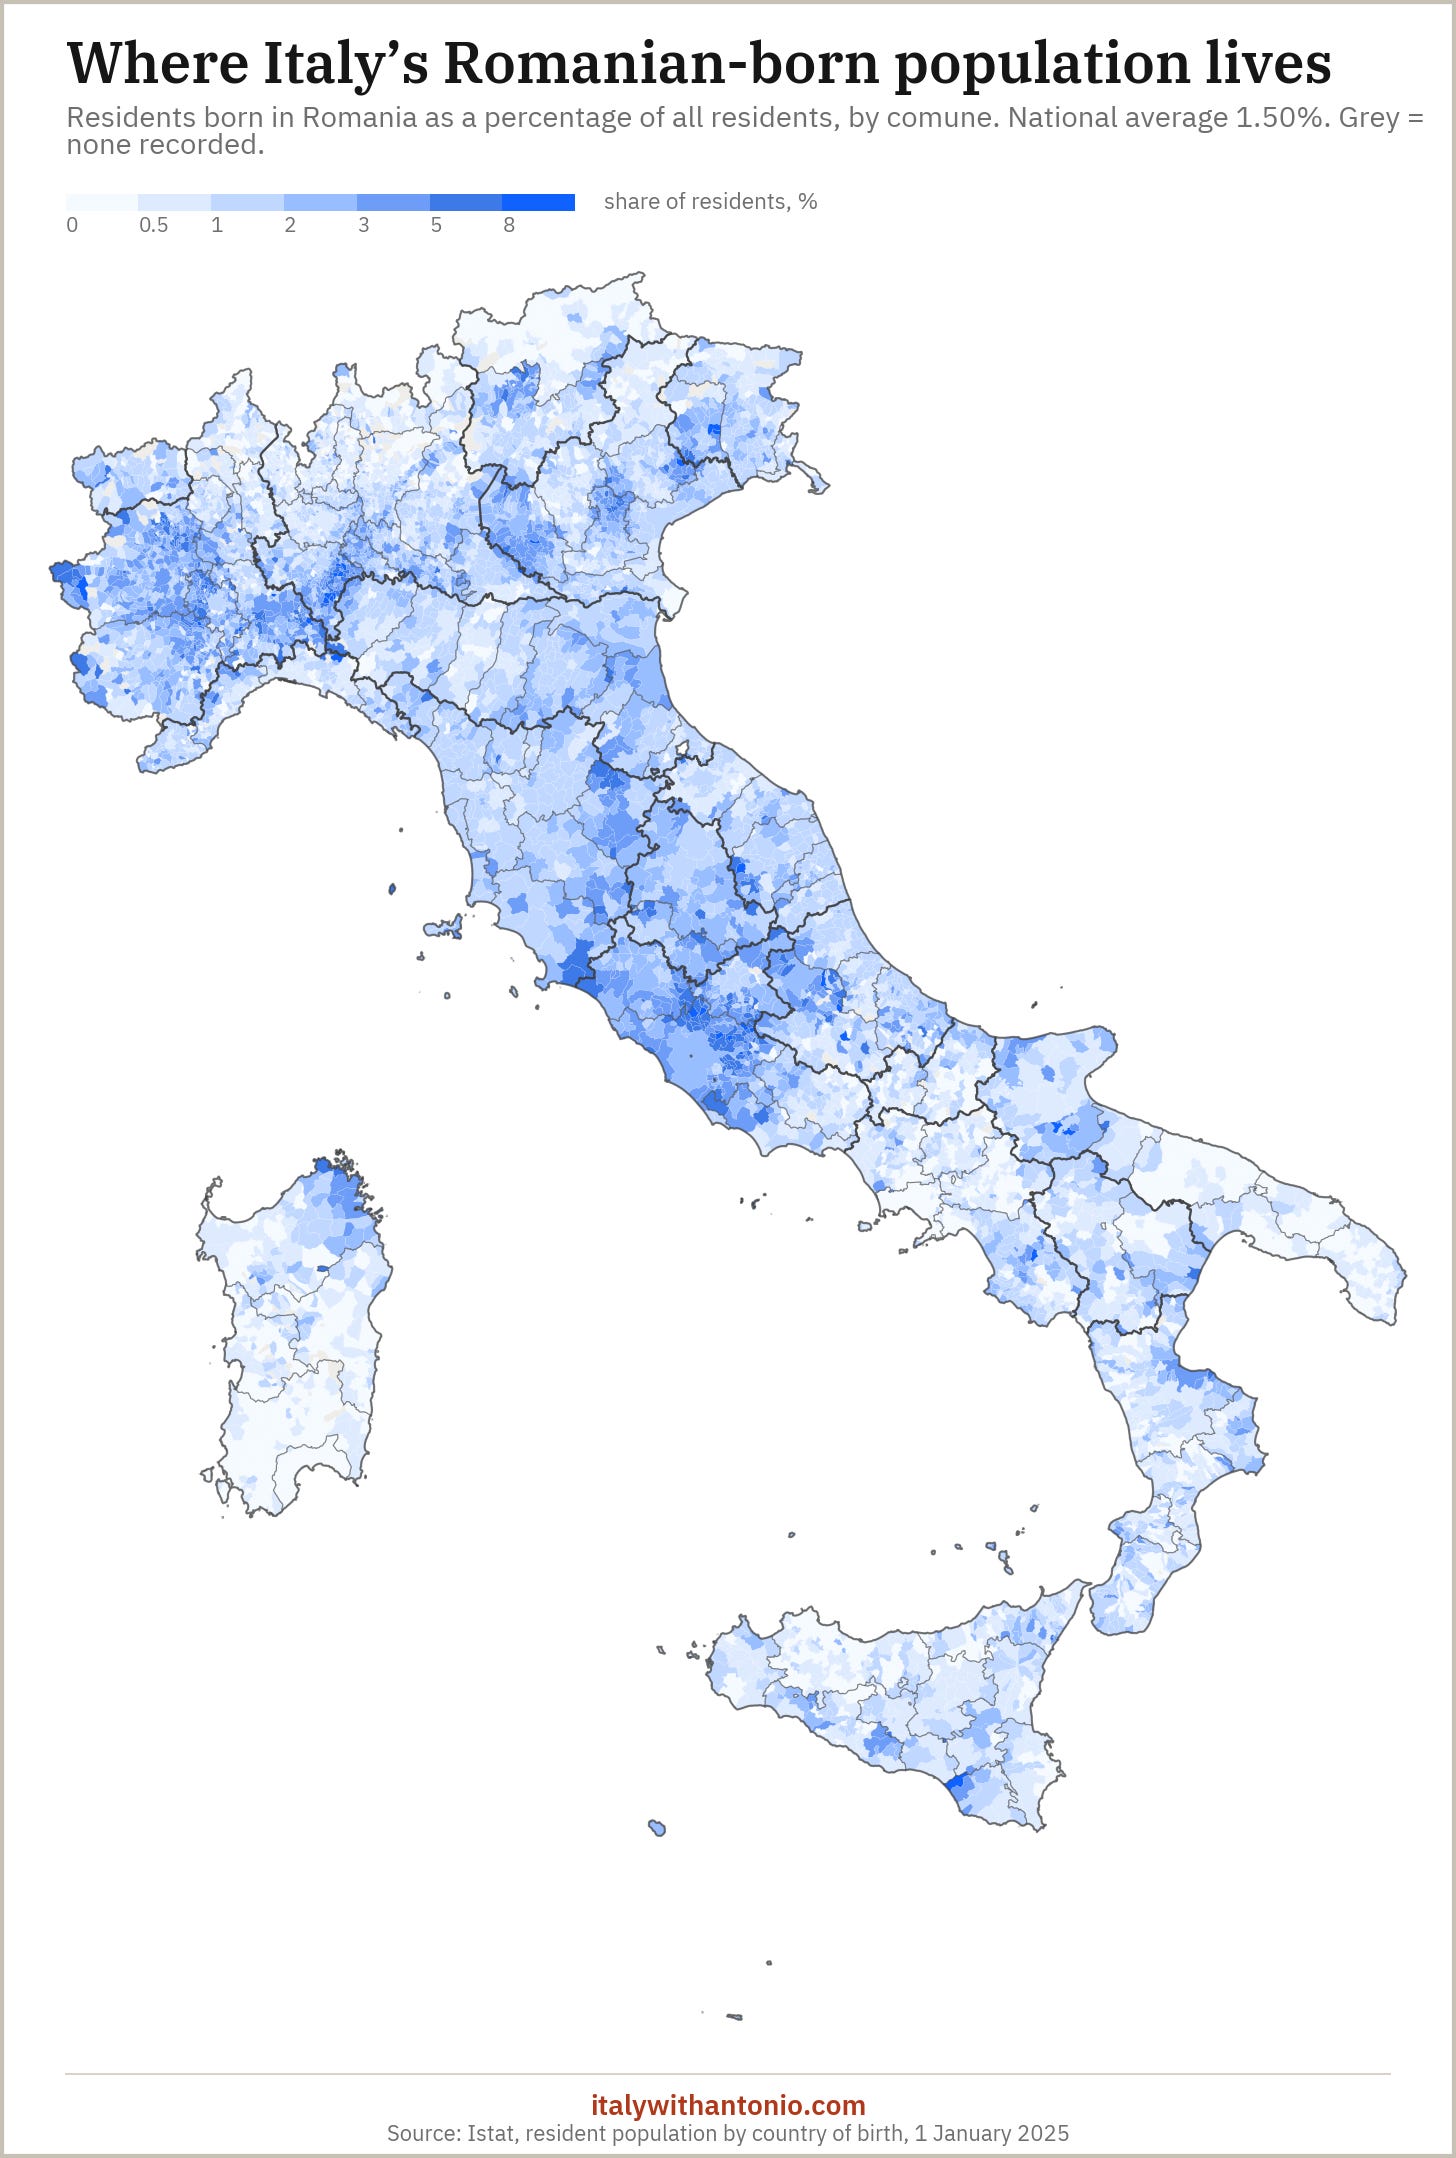
I think it’s fair to say that Romanians are almost everywhere, with a presence in 7,681 of 7,896 comuni. The largest numbers of Romanians are in Rome (59,401) and Turin (34,353).
The most Romanian comuni are:
Pragelato, Turin, 18.44% (130 of 705)
Rivarone, Alessandria, 14.39% (57 of 396)
Borgoratto Mormorolo, Pavia, 14.07% (56 of 398)
San Sebastiano Curone, Alessandria, 13.44% (73 of 543)
Rovescala, Pavia, 13.24% (108 of 816)
Pragelato is an Alpine village of 705 people in the Val Chisone that hosted every Nordic skiing event at the 2006 Winter Olympics. More than one in six of its residents were born in Romania.
The most Romanian provinces, percentage-wise, are:
Viterbo, 3.39% (10,435 of 307,405)
Turin, 3.28% (72,233 of 2,204,276)
Arezzo, 3.22% (10,745 of 333,240)
Terni, 2.95% (6,358 of 215,285)
Rome, 2.90% (122,492 of 4,222,648)
Lowest provinces: Naples 0.258% (7,639), Cagliari 0.330% (1,378), Bari 0.345% (4,213), Sud Sardegna 0.346% (1,141), and Palermo 0.452% (5,413).
Where Albanians live in Italy
Albanians are the Balkan precursors to Romanians. They arrived in Italy in droves in the 90s, ten or so years before Romanians did. The national average for Albanians is 0.98%.
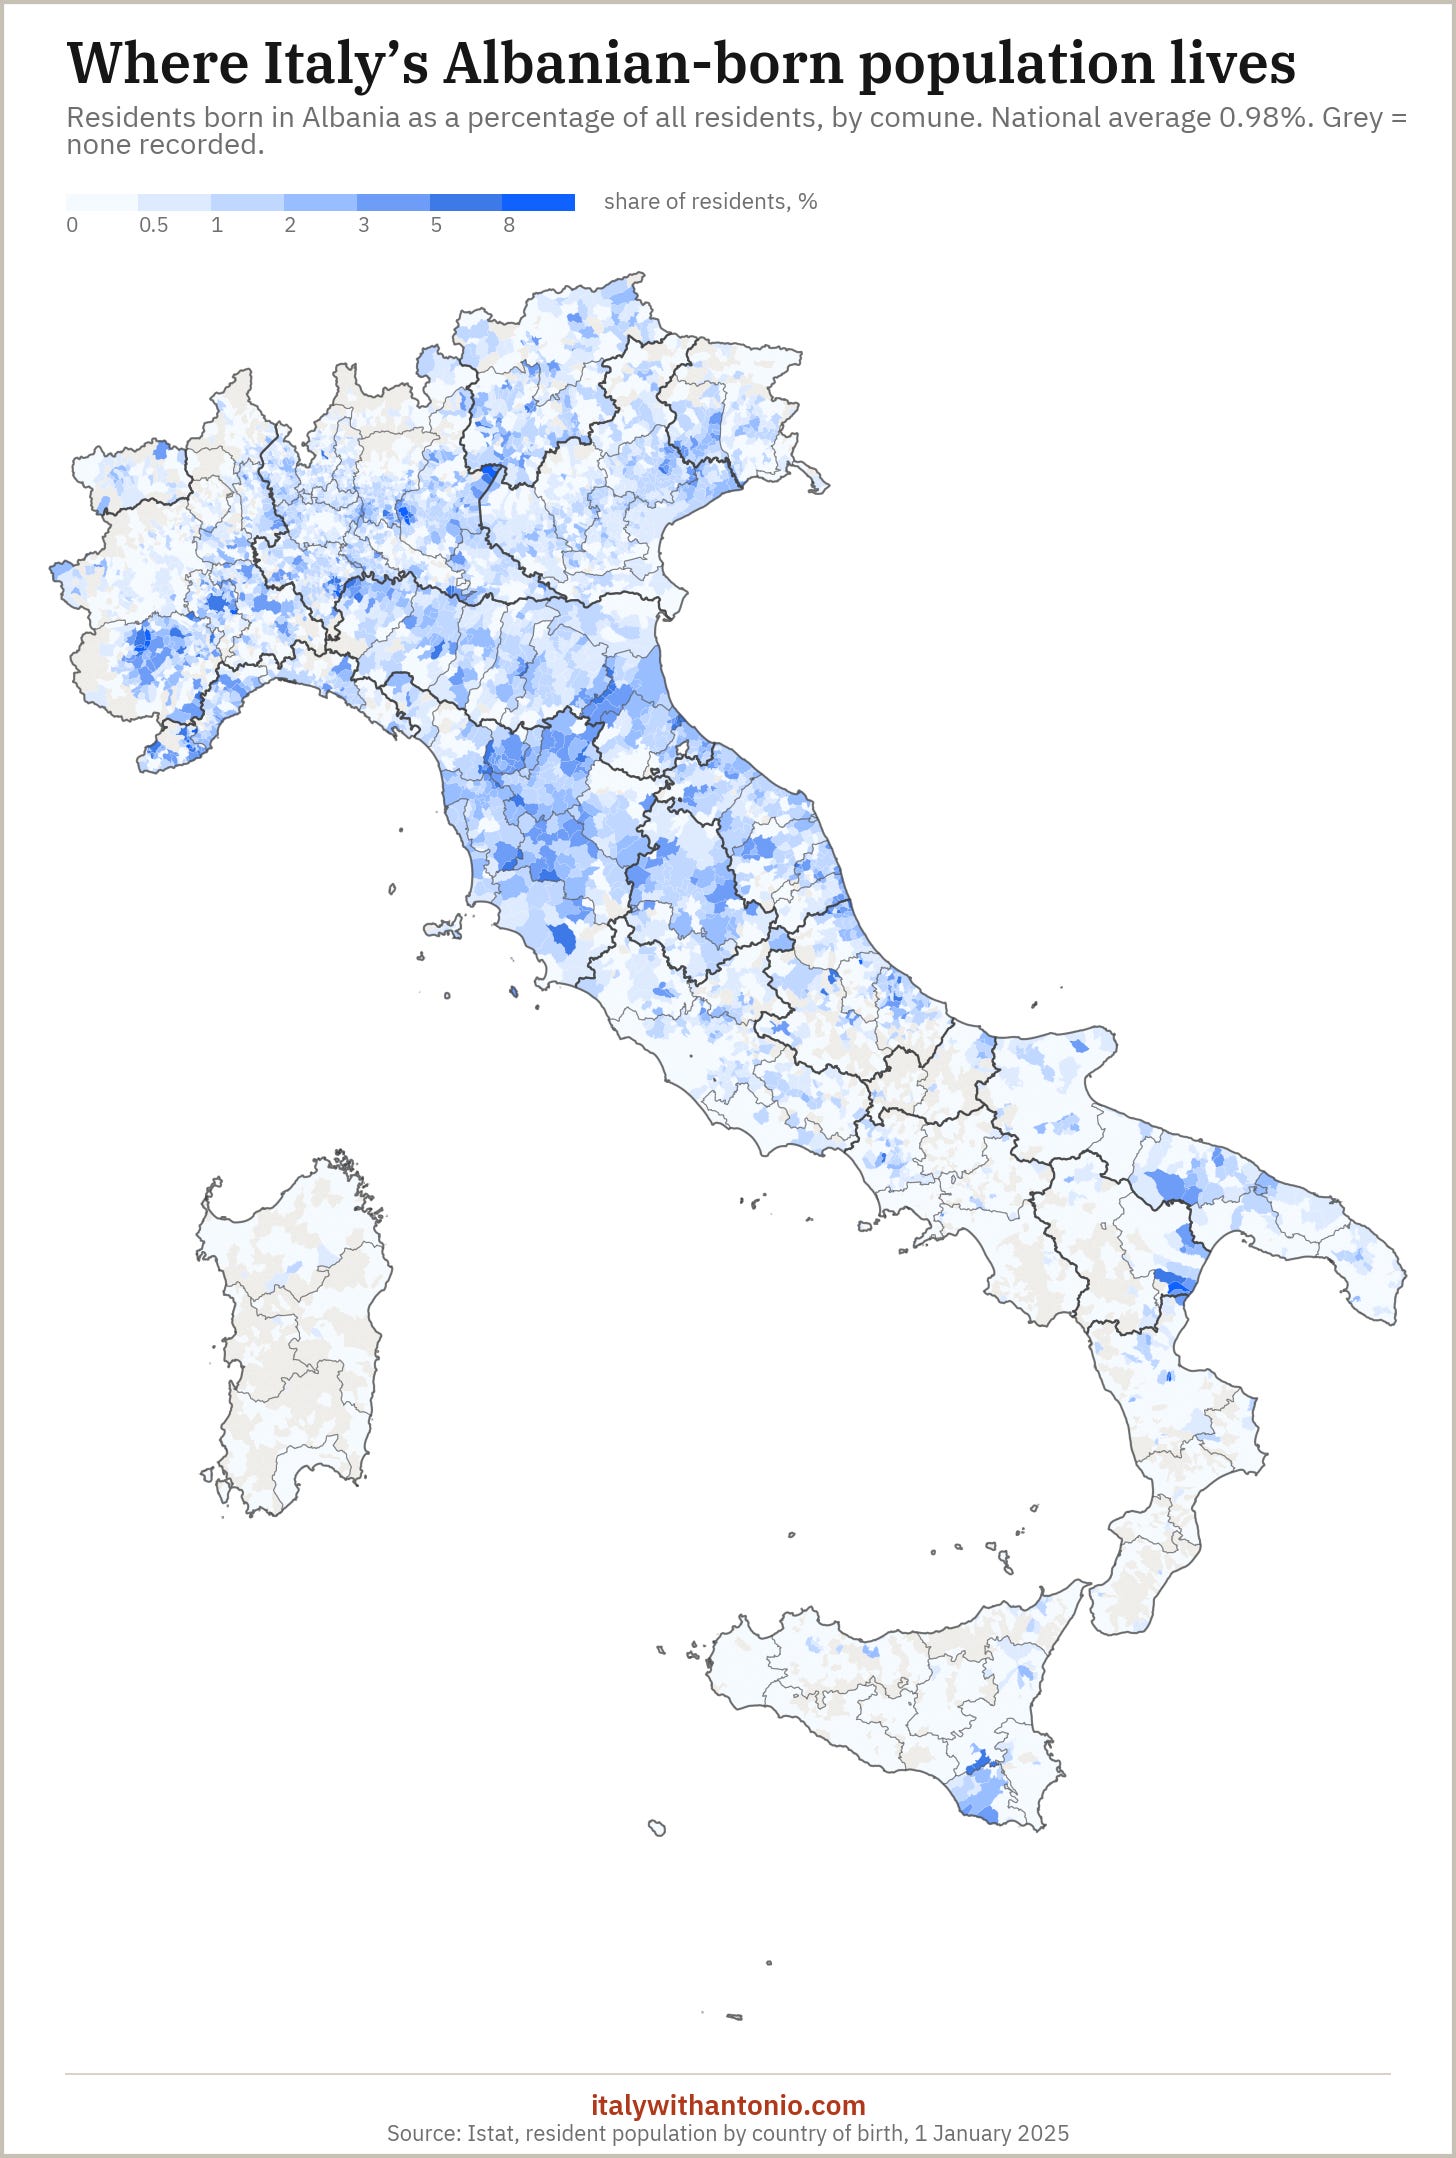
The most Albanian comuni by share are:
Lucinasco, Imperia, 16.72% (51 of 305)
Castelcovati, Brescia, 15.26% (1,077 of 7,059)
Caravonica, Imperia, 12.80% (32 of 250)
Tremosine sul Garda, Brescia, 11.65% (244 of 2,094)
Santa Maria della Versa, Pavia, 11.45% (261 of 2,279)
And the most Albanian provinces are:
Pistoia, 4.11% (11,912 of 289,925)
Savona, 2.84% (7,595 of 267,064)
Rimini, 2.70% (9,196 of 340,376)
Prato, 2.70% (7,003 of 259,657)
Asti, 2.66% (5,516 of 207,203)
Lowest provinces: Sud Sardegna 0.022% (72), Oristano 0.027% (40), Nuoro 0.039% (76), Trapani 0.042% (171), Enna 0.044% (67).
Where Moroccans live in Italy
The Moroccan-born represent 0.86% of the national population. The dark spot just south of the center is in the Abruzzo province of L’Aquila, specifically the Piana del Fucino, which is known as l’orto d’Italia (the vegetable garden of Italy). Moroccans have been working those fields for decades. Often exploited.
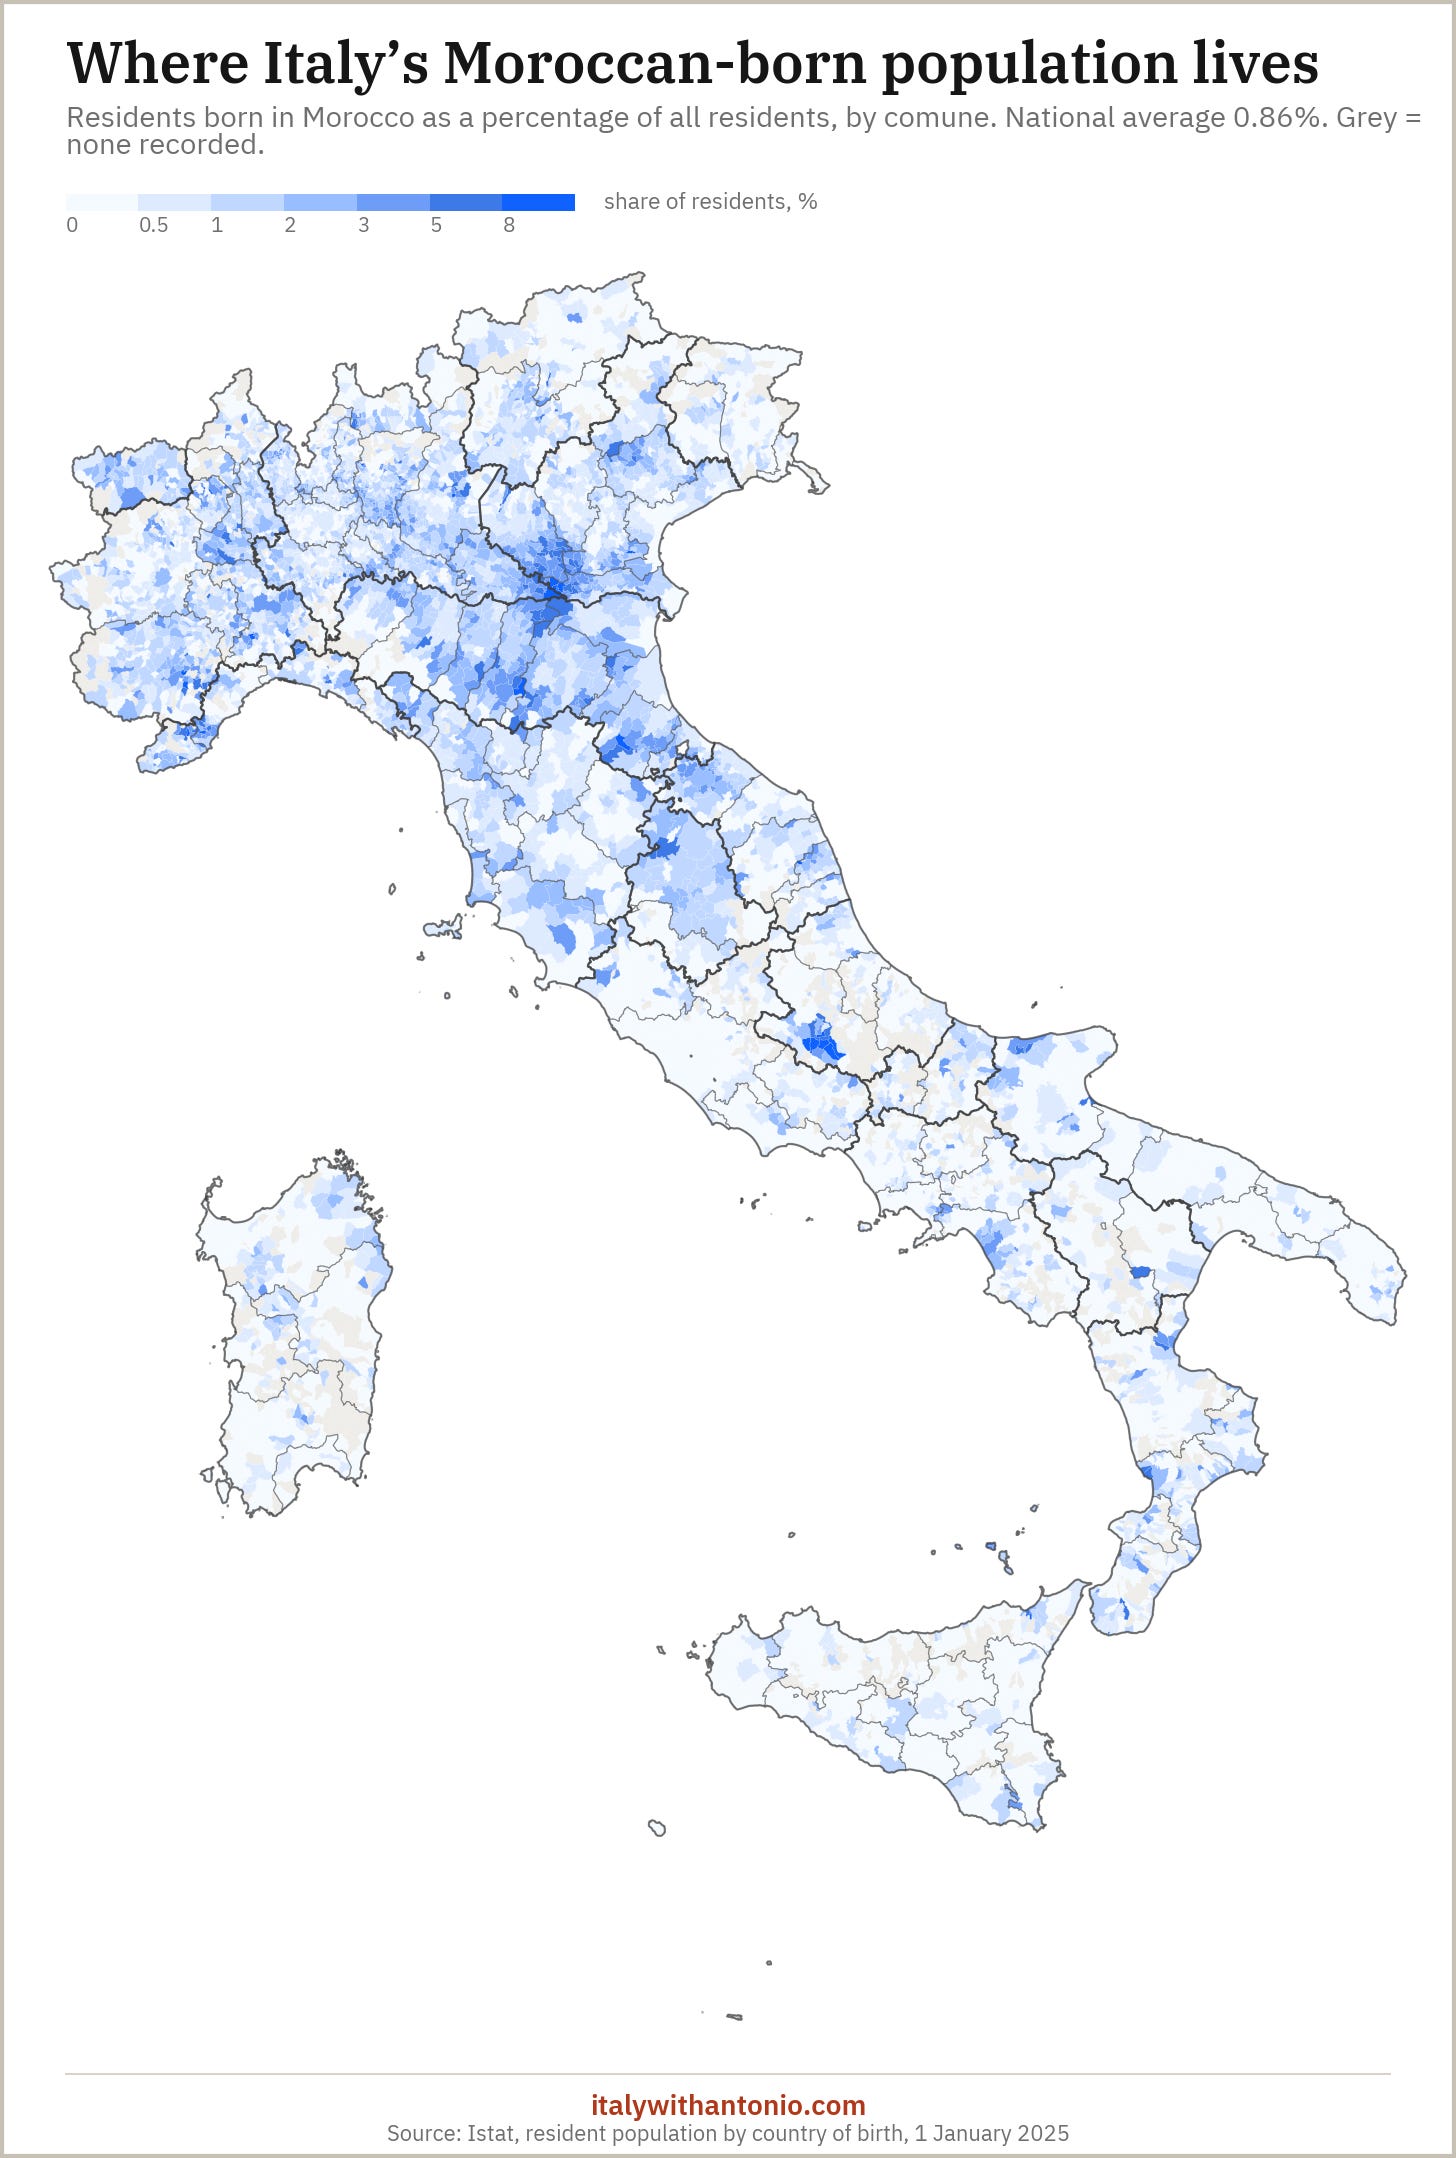
The most Moroccan comuni by share are:
Luco dei Marsi, L’Aquila, 14.77% (869 of 5,884)
Gioia dei Marsi, L’Aquila, 12.03% (203 of 1,688)
Strevi, Alessandria, 11.82% (229 of 1,937)
Sermide e Felonica, Mantua, 11.34% (796 of 7,018)
Bastia Mondovì, Cuneo, 11.29% (71 of 629)
In terms of sheer headcount, the top five are Turin 19,741, Milan 9,202, Genoa 6,395, Rome 5,663, and Bologna 4,218. Turin is much smaller than Milan, and yet it has double the number of Moroccans.
The most Moroccan provinces by share are:
Modena, 2.54% (17,981 of 708,340)
Rovigo, 2.51% (5,693 of 227,134)
Vercelli, 2.48% (4,121 of 165,910)
Mantua, 2.20% (8,984 of 407,744)
Alessandria, 2.11% (8,590 of 407,202)
Lowest provinces: Trieste 0.148% (336), Cagliari 0.160% (666), Catania 0.170% (1,816), Bari 0.190% (2,321), and Palermo 0.197% (2,358).
Where South Americans live in Italy
For South Americans, Germans, Britons, and Americans, I’m using both birthplace data and citizenship. That’s because Italy sent millions of people to those countries. The gap between the two might be instructive.
Here is South America:
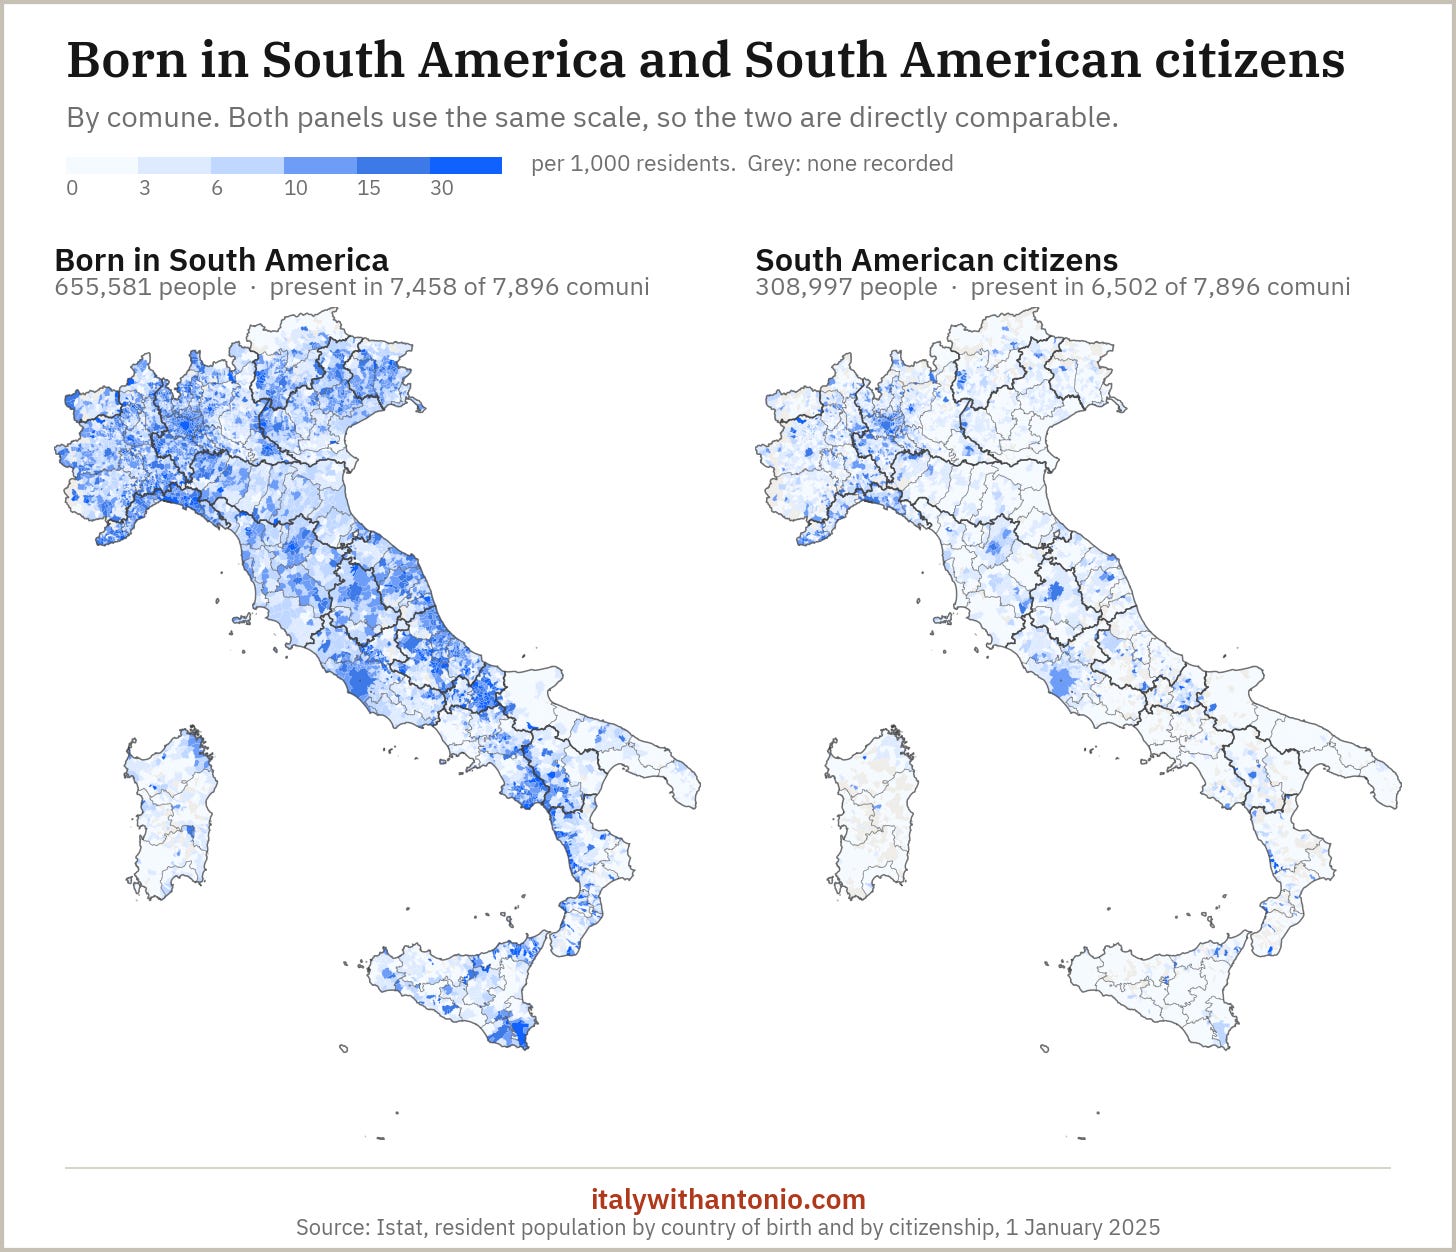
If we take the ratio between the two values, split by country of origin within South America, an obvious pattern emerges: Argentina 6.2 born for every citizen, Uruguay 5.6, Venezuela 4.0, Chile 3.8, Brazil 2.7. Yet Ecuador 1.4, Peru 1.3, and Bolivia 1.3.
My reading, remembering that foreign citizens get erased from the stats when they obtain Italian citizenship, is that the countries of the diaspora are all at the top of the ratio. So a lot of the, say, Argentinian-born in Italy are descendants of Italians coming home. People born in Bolivia who now live in Italy are more likely to be new immigrants with no prior ties to Italy.
Most South American comuni, by share (the national average is 1.11%):
Longobardi, Cosenza, 28.43% (873 of 3,071)
Fiumefreddo Bruzio, Cosenza, 27.84% (1,072 of 3,851)
San Lucido, Cosenza, 22.08% (1,636 of 7,411)
Castel di Lucio, Messina, 21.46% (302 of 1,407)
Nicotera, Vibo Valentia, 20.78% (1,489 of 7,167)
And the most South American provinces are:
Genoa, 3.77% (30,870 of 818,812)
Milan, 2.78% (90,410 of 3,246,455)
Imperia, 2.21% (4,631 of 209,348)
Campobasso, 2.15% (4,492 of 209,059)
Vibo Valentia, 2.05% (3,093 of 150,516)
Lowest provinces: Barletta-Andria-Trani 0.189% (712), Foggia 0.202% (1,190), Crotone 0.209% (339), Brindisi 0.220% (827), and Taranto 0.223% (1,230). All in Apulia, except Crotone, which is in Calabria.
Where Germans live in Italy
Now that we have discussed immigrants, let’s discuss expats. That’s a joke, of course. If you move to Italy, you’re an immigrant whether you are Peruvian or German. It’s just that the de facto tendency is to call the former immigrants and the latter expats.
In the maps below, the cluster in South Tyrol shouldn’t surprise anyone. That area of the country is culturally very German, and over half the population already speaks the language. It’s a smooth transition for someone coming from Germany.
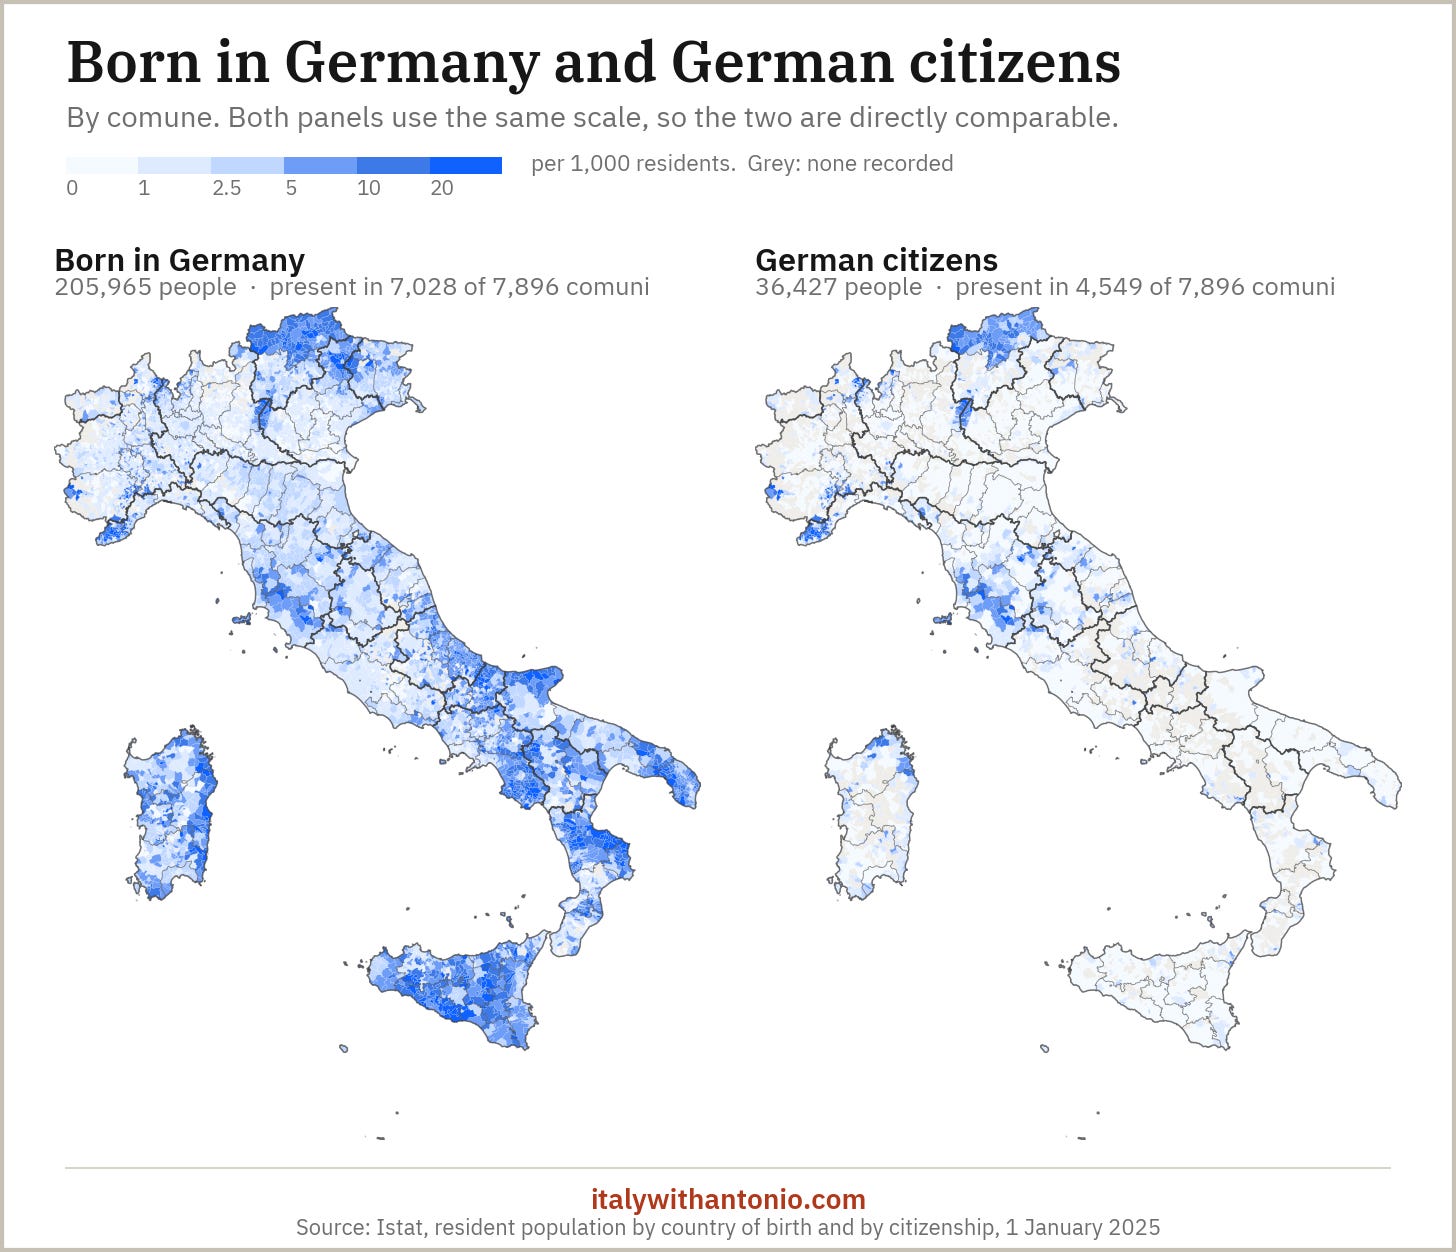
The national average for German-born is 0.35% (205,965 people).
Top 5 comuni by share
Zoppè di Cadore, Belluno, 24.44% (44 of 180)
Val di Zoldo, Belluno, 15.65% (428 of 2,735)
Terravecchia, Cosenza, 9.57% (54 of 564)
Scala Coeli, Cosenza, 7.80% (59 of 756)
Igliano, Cuneo, 7.69% (5 of 65)
Top 5 comuni by headcount
Rome, 5,595 (0.20%)
Milan, 3,493 (0.26%)
Corigliano-Rossano, 2,010 (2.70%)
Turin, 1,620 (0.19%)
Bolzano, 1,257 (1.18%)
Top 5 provinces by share
Agrigento, 1.91% (7,812 of 408,401)
Enna, 1.70% (2,591 of 152,544)
Bolzano, 1.46% (7,864 of 539,679)
Cosenza, 1.18% (7,896 of 669,535)
Crotone, 1.10% (1,773 of 161,898)
Lowest provinces: Rovigo 0.10% (223), Padua 0.14% (1,275), Bergamo 0.14% (1,560), and Sondrio 0.14% (256).
Where Britons live in Italy
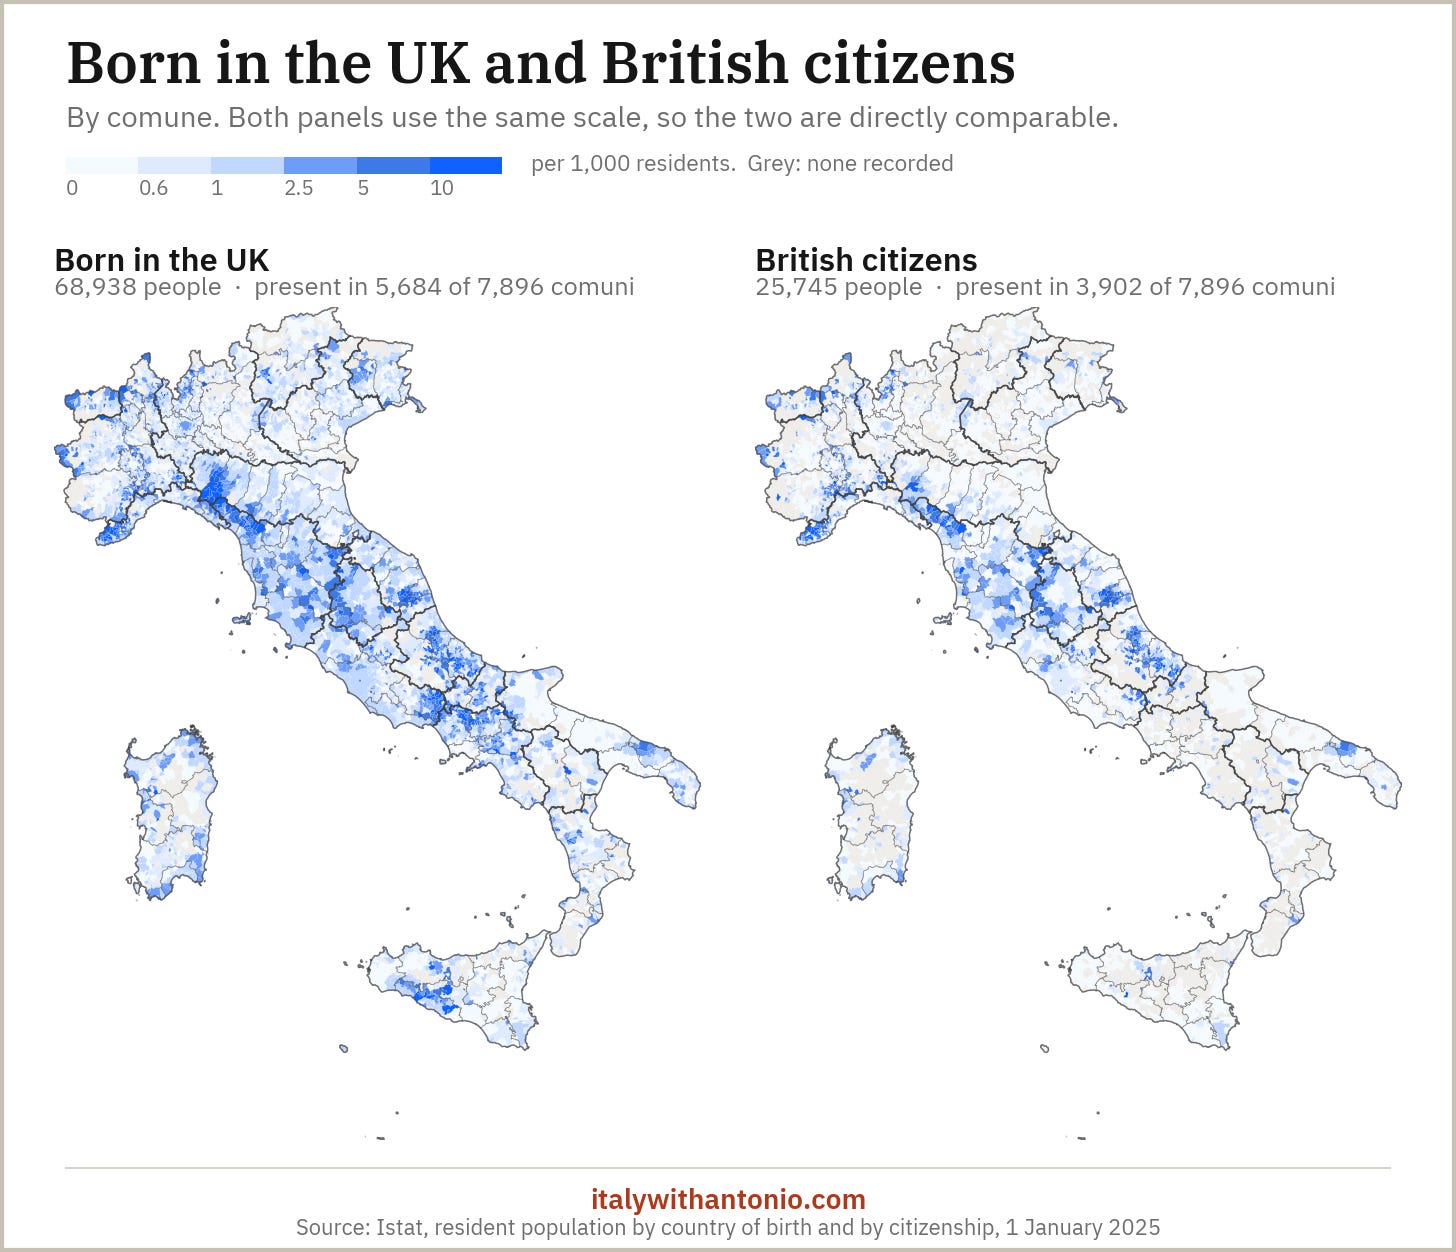
The national average for UK-born residents is 0.117% (68,938 people).
Top 5 comuni by share
Fosciandora, Lucca, 7.04% (39 of 554)
Armo, Imperia, 6.72% (8 of 119)
Acquaviva Platani, Caltanissetta, 6.68% (56 of 838)
Palombaro, Chieti, 6.68% (63 of 943)
Molini di Triora, Imperia, 6.53% (40 of 613)
Top 5 comuni by headcount
Rome, 5,006 (0.18%)
Milan, 3,502 (0.26%)
Turin, 925 (0.11%)
Florence, 844 (0.23%)
Bologna, 560 (0.14%)
Top 5 provinces by share
Lucca, 0.432% (1,646 of 381,390)
Avellino, 0.359% (1,419 of 395,072)
Imperia, 0.320% (670 of 209,348)
Agrigento, 0.309% (1,264 of 408,401)
Frosinone, 0.306% (1,416 of 462,661)
Lowest provinces: Barletta-Andria-Trani 0.027% (101), Rovigo 0.033% (76), Crotone 0.038% (62), and Taranto 0.041% (227).
Where Americans live in Italy
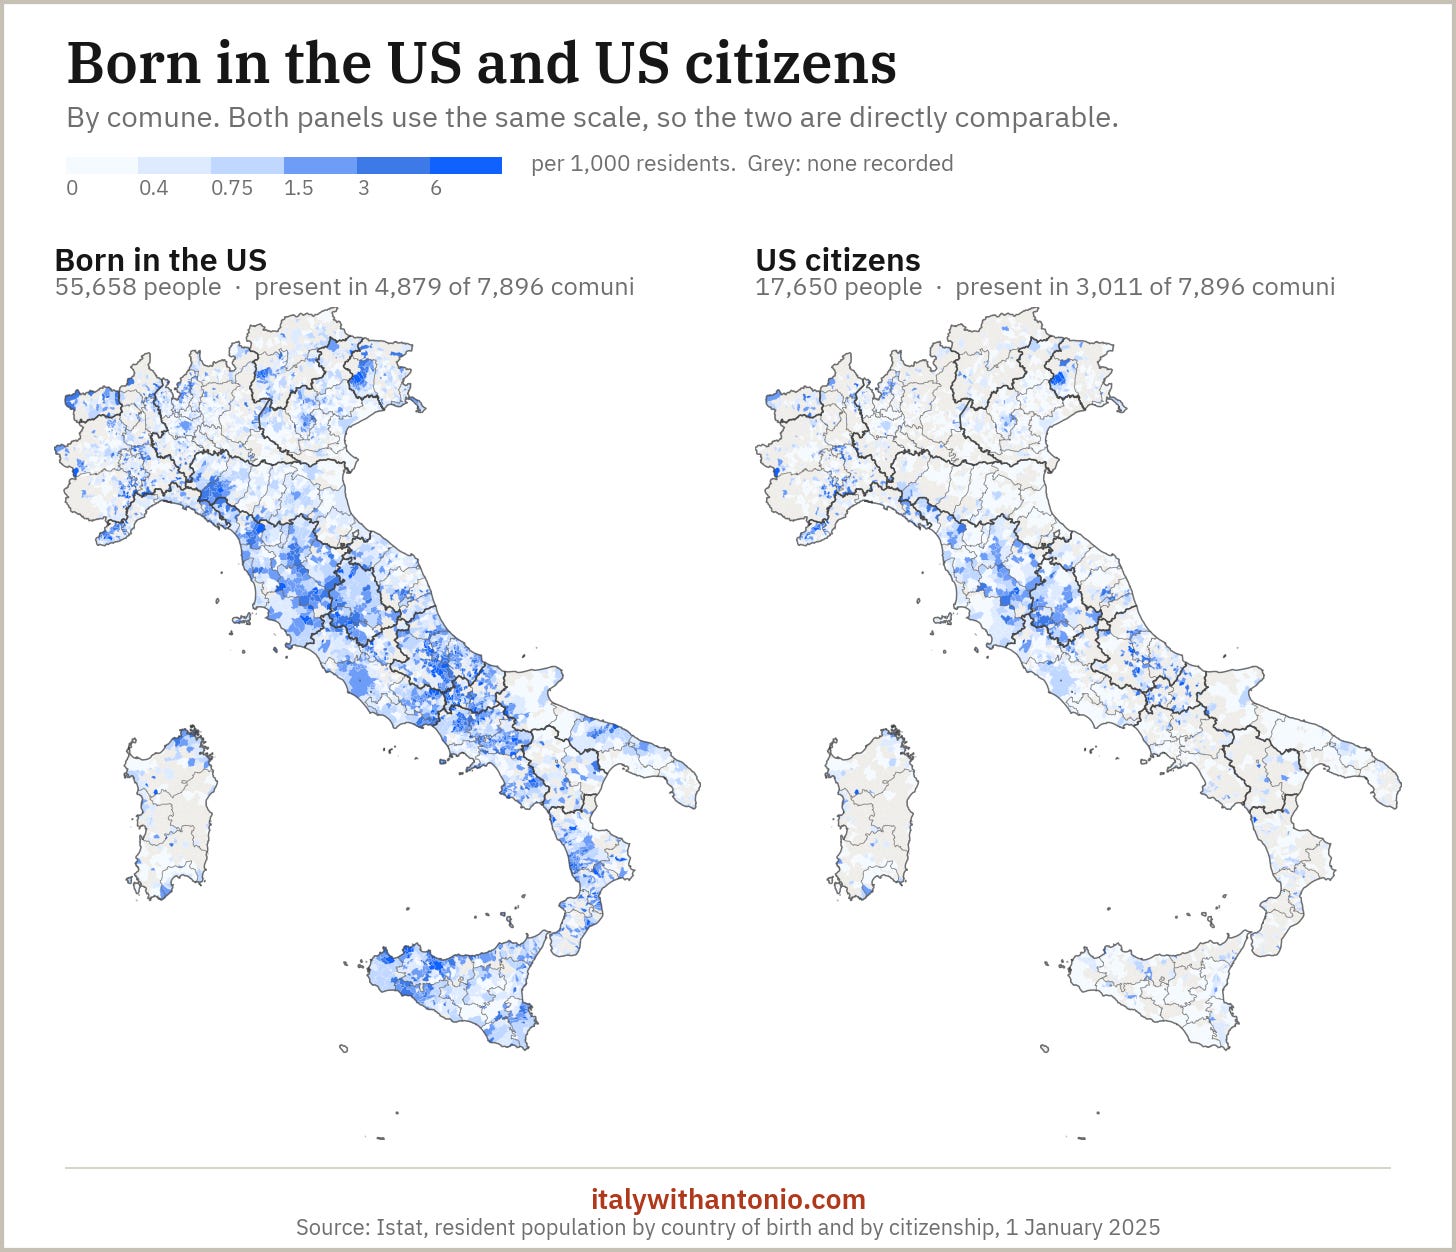
The national average for US-born residents is 0.094% (55,658 people).
Top 5 comuni by share
Massimeno, Trento, 3.73% (5 of 134)
Palermiti, Catanzaro, 3.55% (37 of 1,041)
Roccafiorita, Messina, 3.12% (5 of 160)
Pizzone, Isernia, 3.00% (9 of 300)
Sassinoro, Benevento, 2.60% (16 of 615)
Top 5 comuni by headcount
Rome, 5,445 (0.20%)
Milan, 3,115 (0.23%)
Florence, 1,584 (0.44%)
Turin, 753 (0.09%)
Bologna, 699 (0.18%)
Top 5 provinces by share
Isernia, 0.269% (212 of 78,755)
Florence, 0.247% (2,442 of 988,068)
Lucca, 0.242% (924 of 381,390)
Palermo, 0.231% (2,767 of 1,198,738)
Avellino, 0.219% (866 of 395,072)
Lowest provinces: Nuoro 0.017% (34), Mantua 0.021% (86), Sud Sardegna 0.023% (75), and Taranto 0.028% (153).
Where the Dutch live in Italy
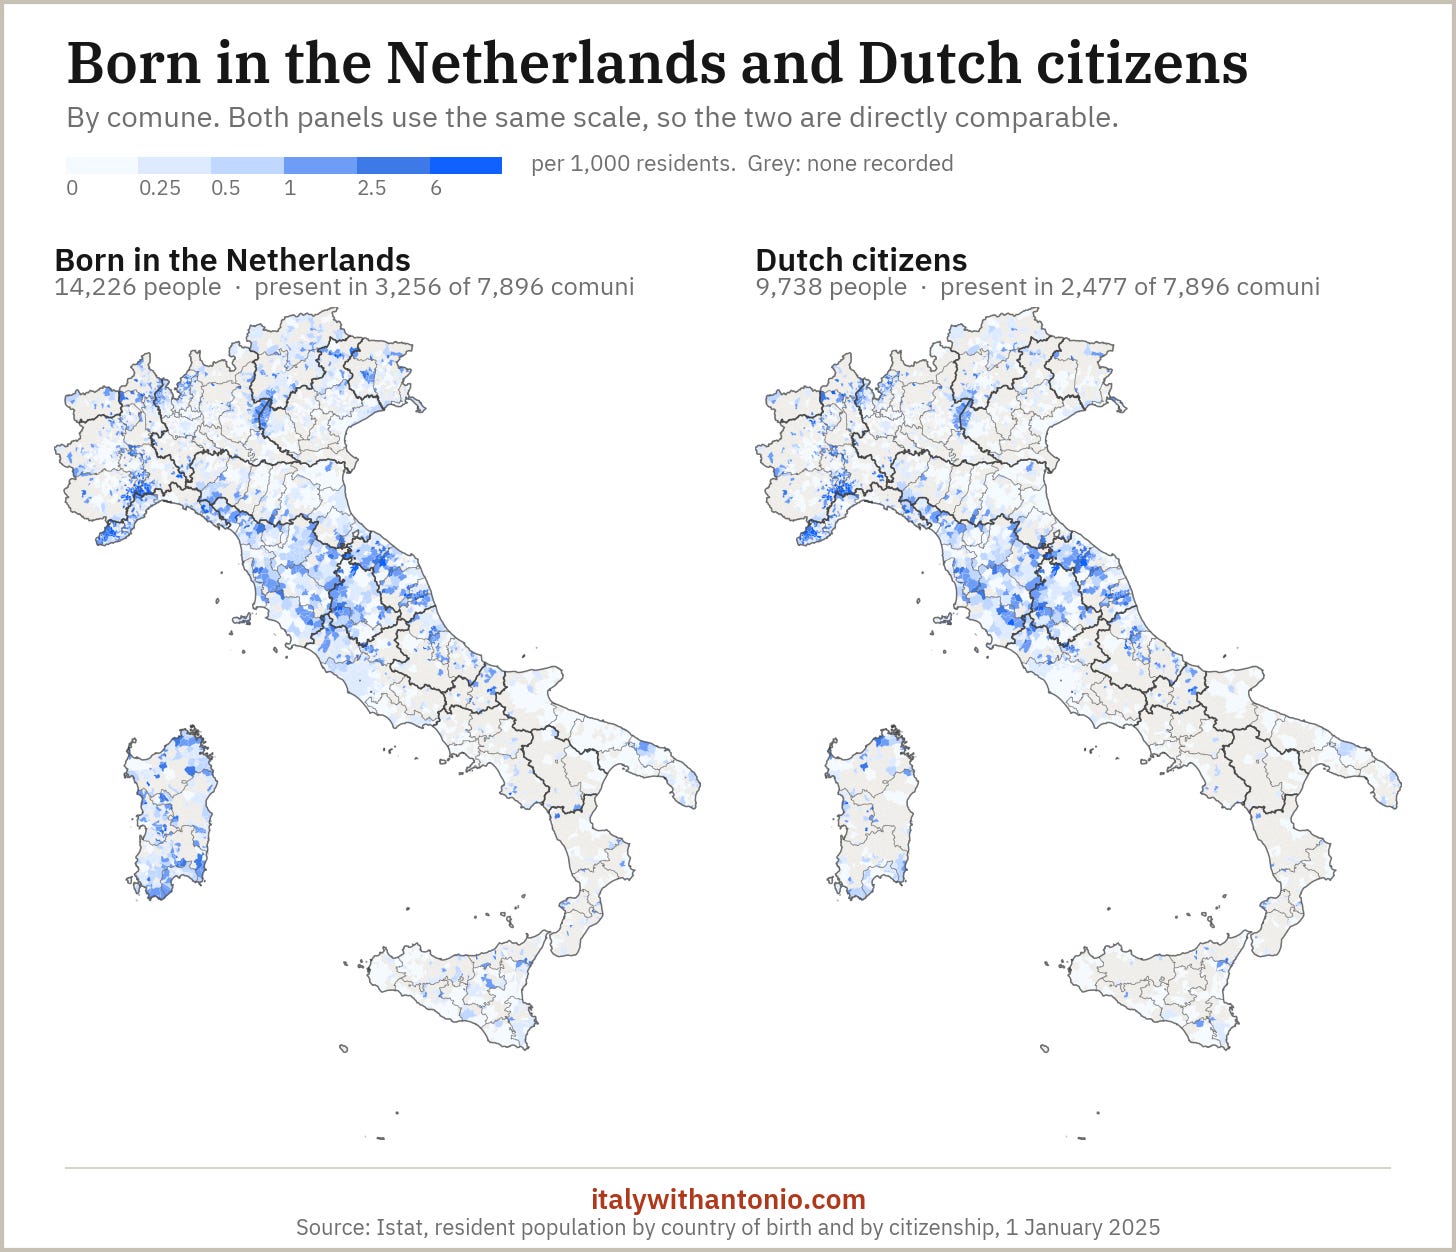
The national average for Dutch-born is 0.024% (14,226 people).
Top 5 comuni by share
Airole, Imperia, 10.03% (37 of 369)
Olmo Gentile, Asti, 4.41% (3 of 68)
Mombarcaro, Cuneo, 4.21% (11 of 261)
Castelletto d’Erro, Alessandria, 3.15% (4 of 127)
Denice, Alessandria, 3.09% (5 of 162)
Top 5 comuni by headcount
Rome, 811 (0.03%)
Milan, 597 (0.04%)
Florence, 210 (0.06%)
Turin, 151 (0.02%)
Genoa, 121 (0.02%)
Top 5 provinces by share
Imperia, 0.131% (275 of 209,348)
Sud Sardegna, 0.069% (226 of 329,556)
Savona, 0.068% (181 of 267,064)
Pesaro e Urbino, 0.062% (216 of 349,558)
Varese, 0.058% (515 of 882,592)
Lowest provinces: Barletta-Andria-Trani 0.003% (12), Rovigo 0.004% (9), Potenza 0.004% (15), and Frosinone 0.005% (21).
The provinces with the smallest share of immigrants
If you want to really mingle with the locals and feel like a rare immigrant there, these are the provinces with the smallest share of immigrants:
Sud Sardegna, 3.53% (11,631 of 329,556)
Barletta-Andria-Trani, 3.85% (14,528 of 377,093)
Oristano, 4.19% (6,207 of 148,005)
Taranto, 4.46% (24,531 of 550,436)
Palermo, 4.56% (54,705 of 1,198,738)
Nuoro, 5.05% (9,872 of 195,331)
Catania, 5.08% (54,412 of 1,070,169)
Naples, 5.10% (151,174 of 2,963,633)
Cagliari, 5.24% (21,871 of 417,532)
Bari, 5.47% (66,760 of 1,219,545)
All in the south. It’s worth noting that the list would look different if we went by citizenship instead of foreign-born. I chose the latter as it’s a better proxy for the true immigrant count, since citizenship undercounts it once people naturalize, as already discussed.
And there are even five comuni with no foreign-born residents at all. All tiny:
Pagnona, Lecco, 310 residents
Castelverrino, Isernia, 89
Celle di Macra, Cuneo, 88
Isasca, Cuneo, 67
Morterone, Lecco, 32
Sources and credits
Map data are credited on each image. Administrative boundaries are Istat’s, obtained via openpolis/geojson-italy and released under CC BY 4.0. Comune population and code lookups come from Open Data Sicilia’s comuni-italiani. Maps built in Python by me. All analysis, classification, and errors are mine.
I don't understand the desire of Anglos to live in Anglo colonies when they go abroad. If I wanted to live in an Anglo country I'd go back to one. I came here bcs I DIDN't want to live around Anglos.
I meant to ask about numbers of immigrants from English language nations. Recently learned from you or Matti or Ale that there was a significant community of English speakers in Scalea, which was a surprise. The density as a percentage of population would be very interesting as an overlay on tourist numbers. Despite “Under the Tuscan Sun”, I wonder if the “relocalizing” (Matteo) is positively correlated against English language tourists. Honestly, that would be my bias, but a few families sharing the first language - and a story of resettlement- is also appealing