


Italy with Antonio. Honest guides for moving to, traveling in, and understanding Italy from a native Italian. Three articles a week, with deeper resources for paid members (including the print-ready PDF and ePub downloads of this article). A Substack Bestseller. Join nearly 2,000 subscribers.
“You say Italians complain a lot. Is there a place where they are happy?” I jokingly replied to my inquiring fiancée: “Yeah, outside of Italy. On vacation.” But it got me thinking about the real answer. I spend my evenings knee-deep in Istat data, and I’ve seen some indicators that could give us conclusive answers.
So I started investigating, focusing on specific indexes that either flat-out address happiness or give us adjacent information such as perceived safety, which could be useful for someone considering a move to Italy.
I generated eight “heat maps” (technically, choropleths) to visualize my findings. All data is based on Istat 2024 census figures.
And yes, I struggled not to title this “Fear and Loathing in Italy.” It was not easy, but I managed.
The happiness maps of Italy
Let’s start with the most direct one: the map of happiness in Italy. The map expresses what percentage of the local population feels that their life is an 8-10 out of 10. In other words, what percentage is genuinely satisfied with their lives. Darker is better.
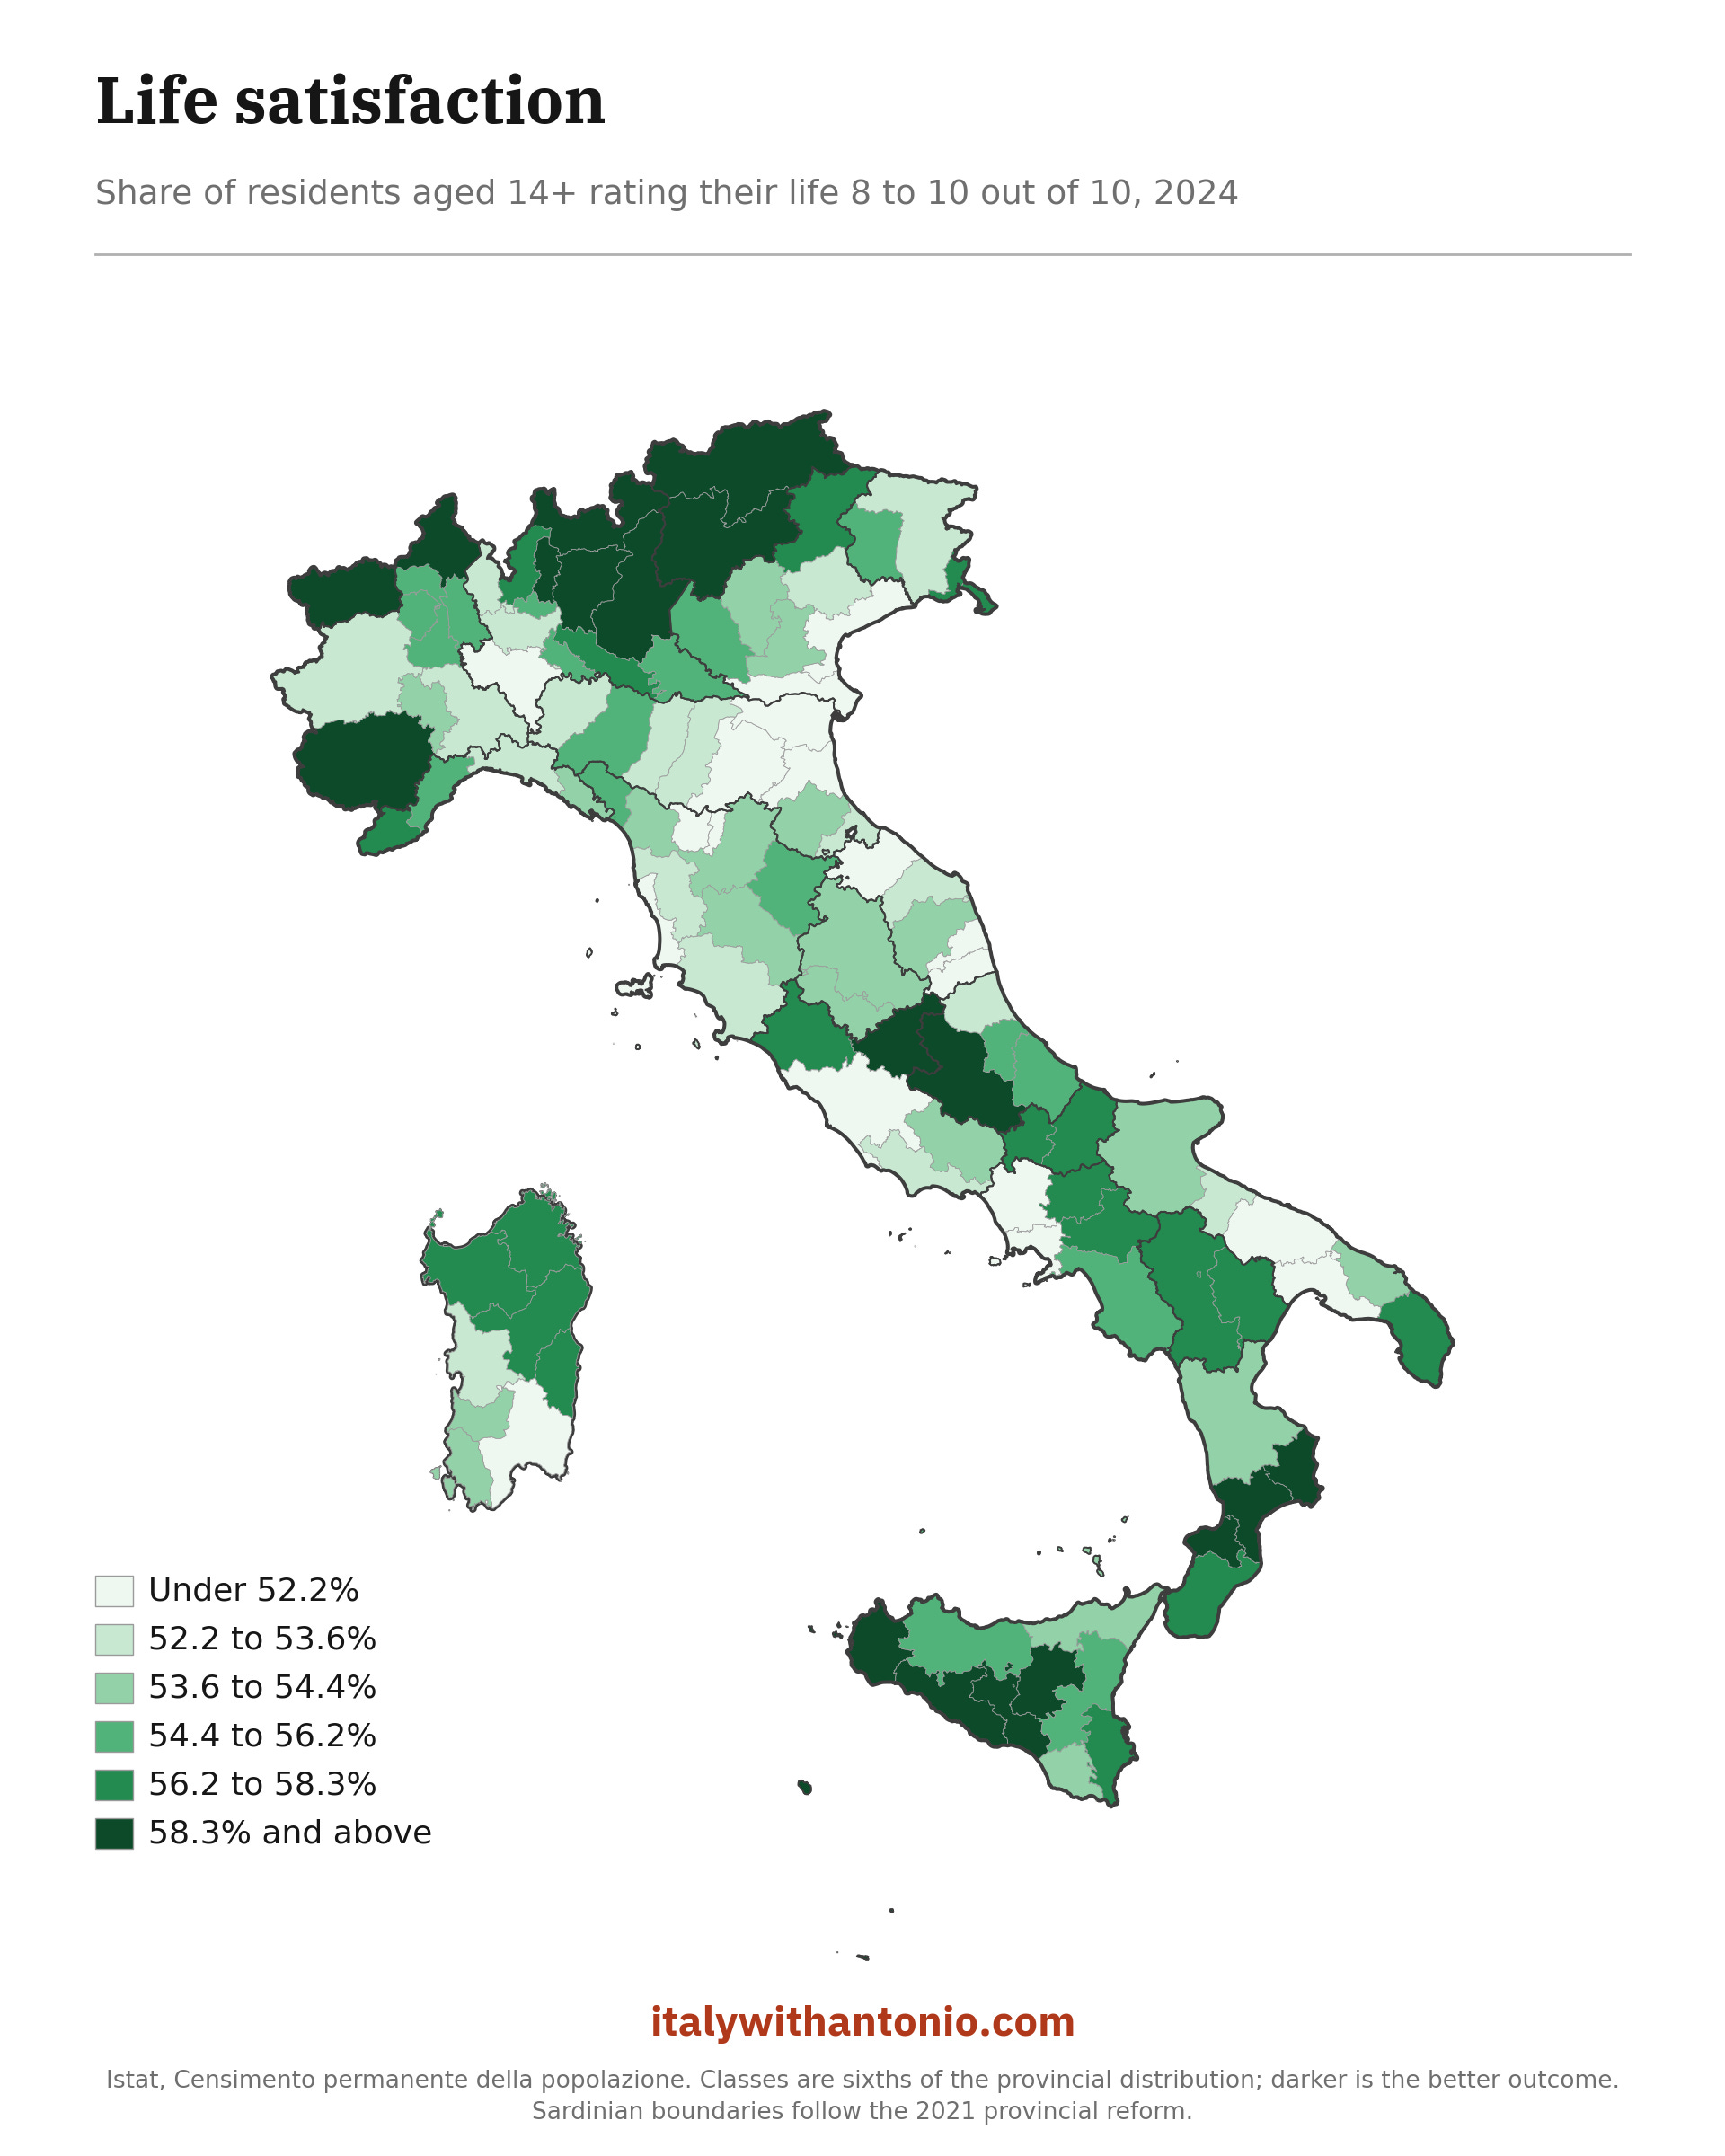
Overall, the national satisfaction rate is at 53.8%, up from 52.0% back in 2022.
What’s remarkable is that, as you can see, it’s not a clean north-south split. The top provinces in terms of life satisfaction are: Bolzano, Enna, Trento, Sondrio, Crotone. Three alpine northern provinces and two extreme southern ones. And the lowest life satisfaction goes to Naples, also in the south.
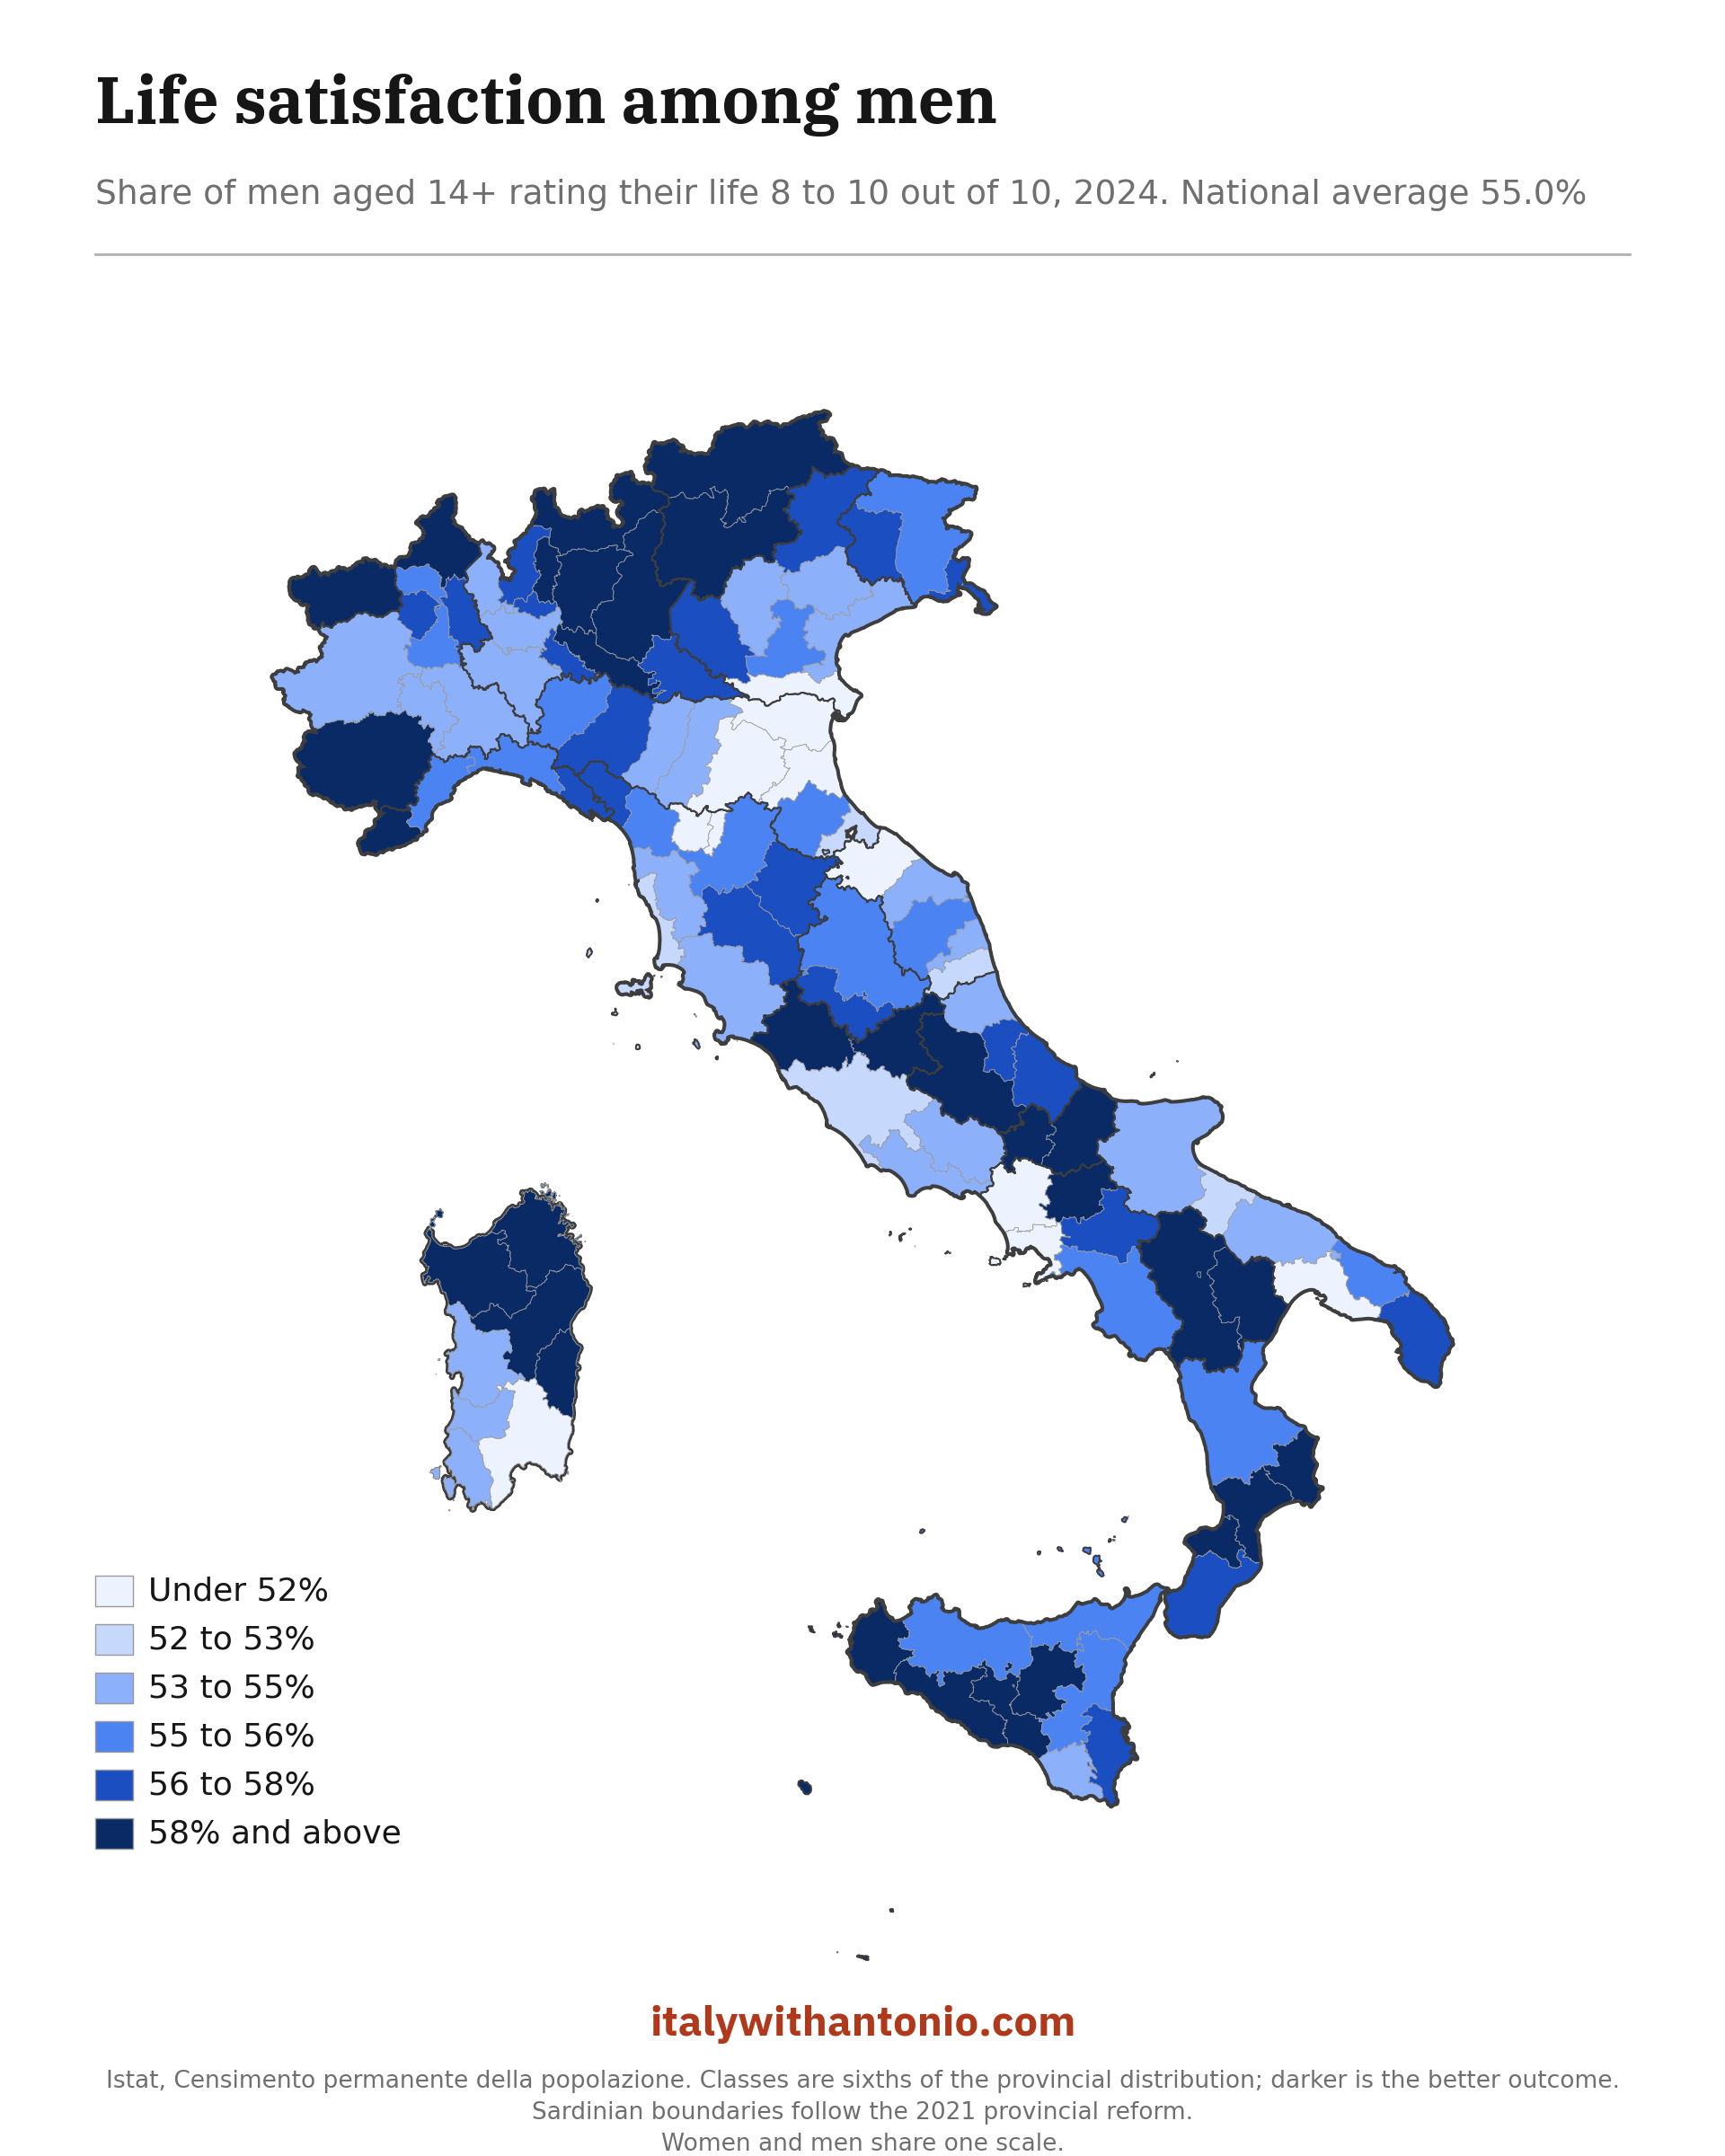
Istat split the data by gender, so I poked at it and came up with the same map split by gender. Here’s the men’s satisfaction rate:
And here is the women’s:
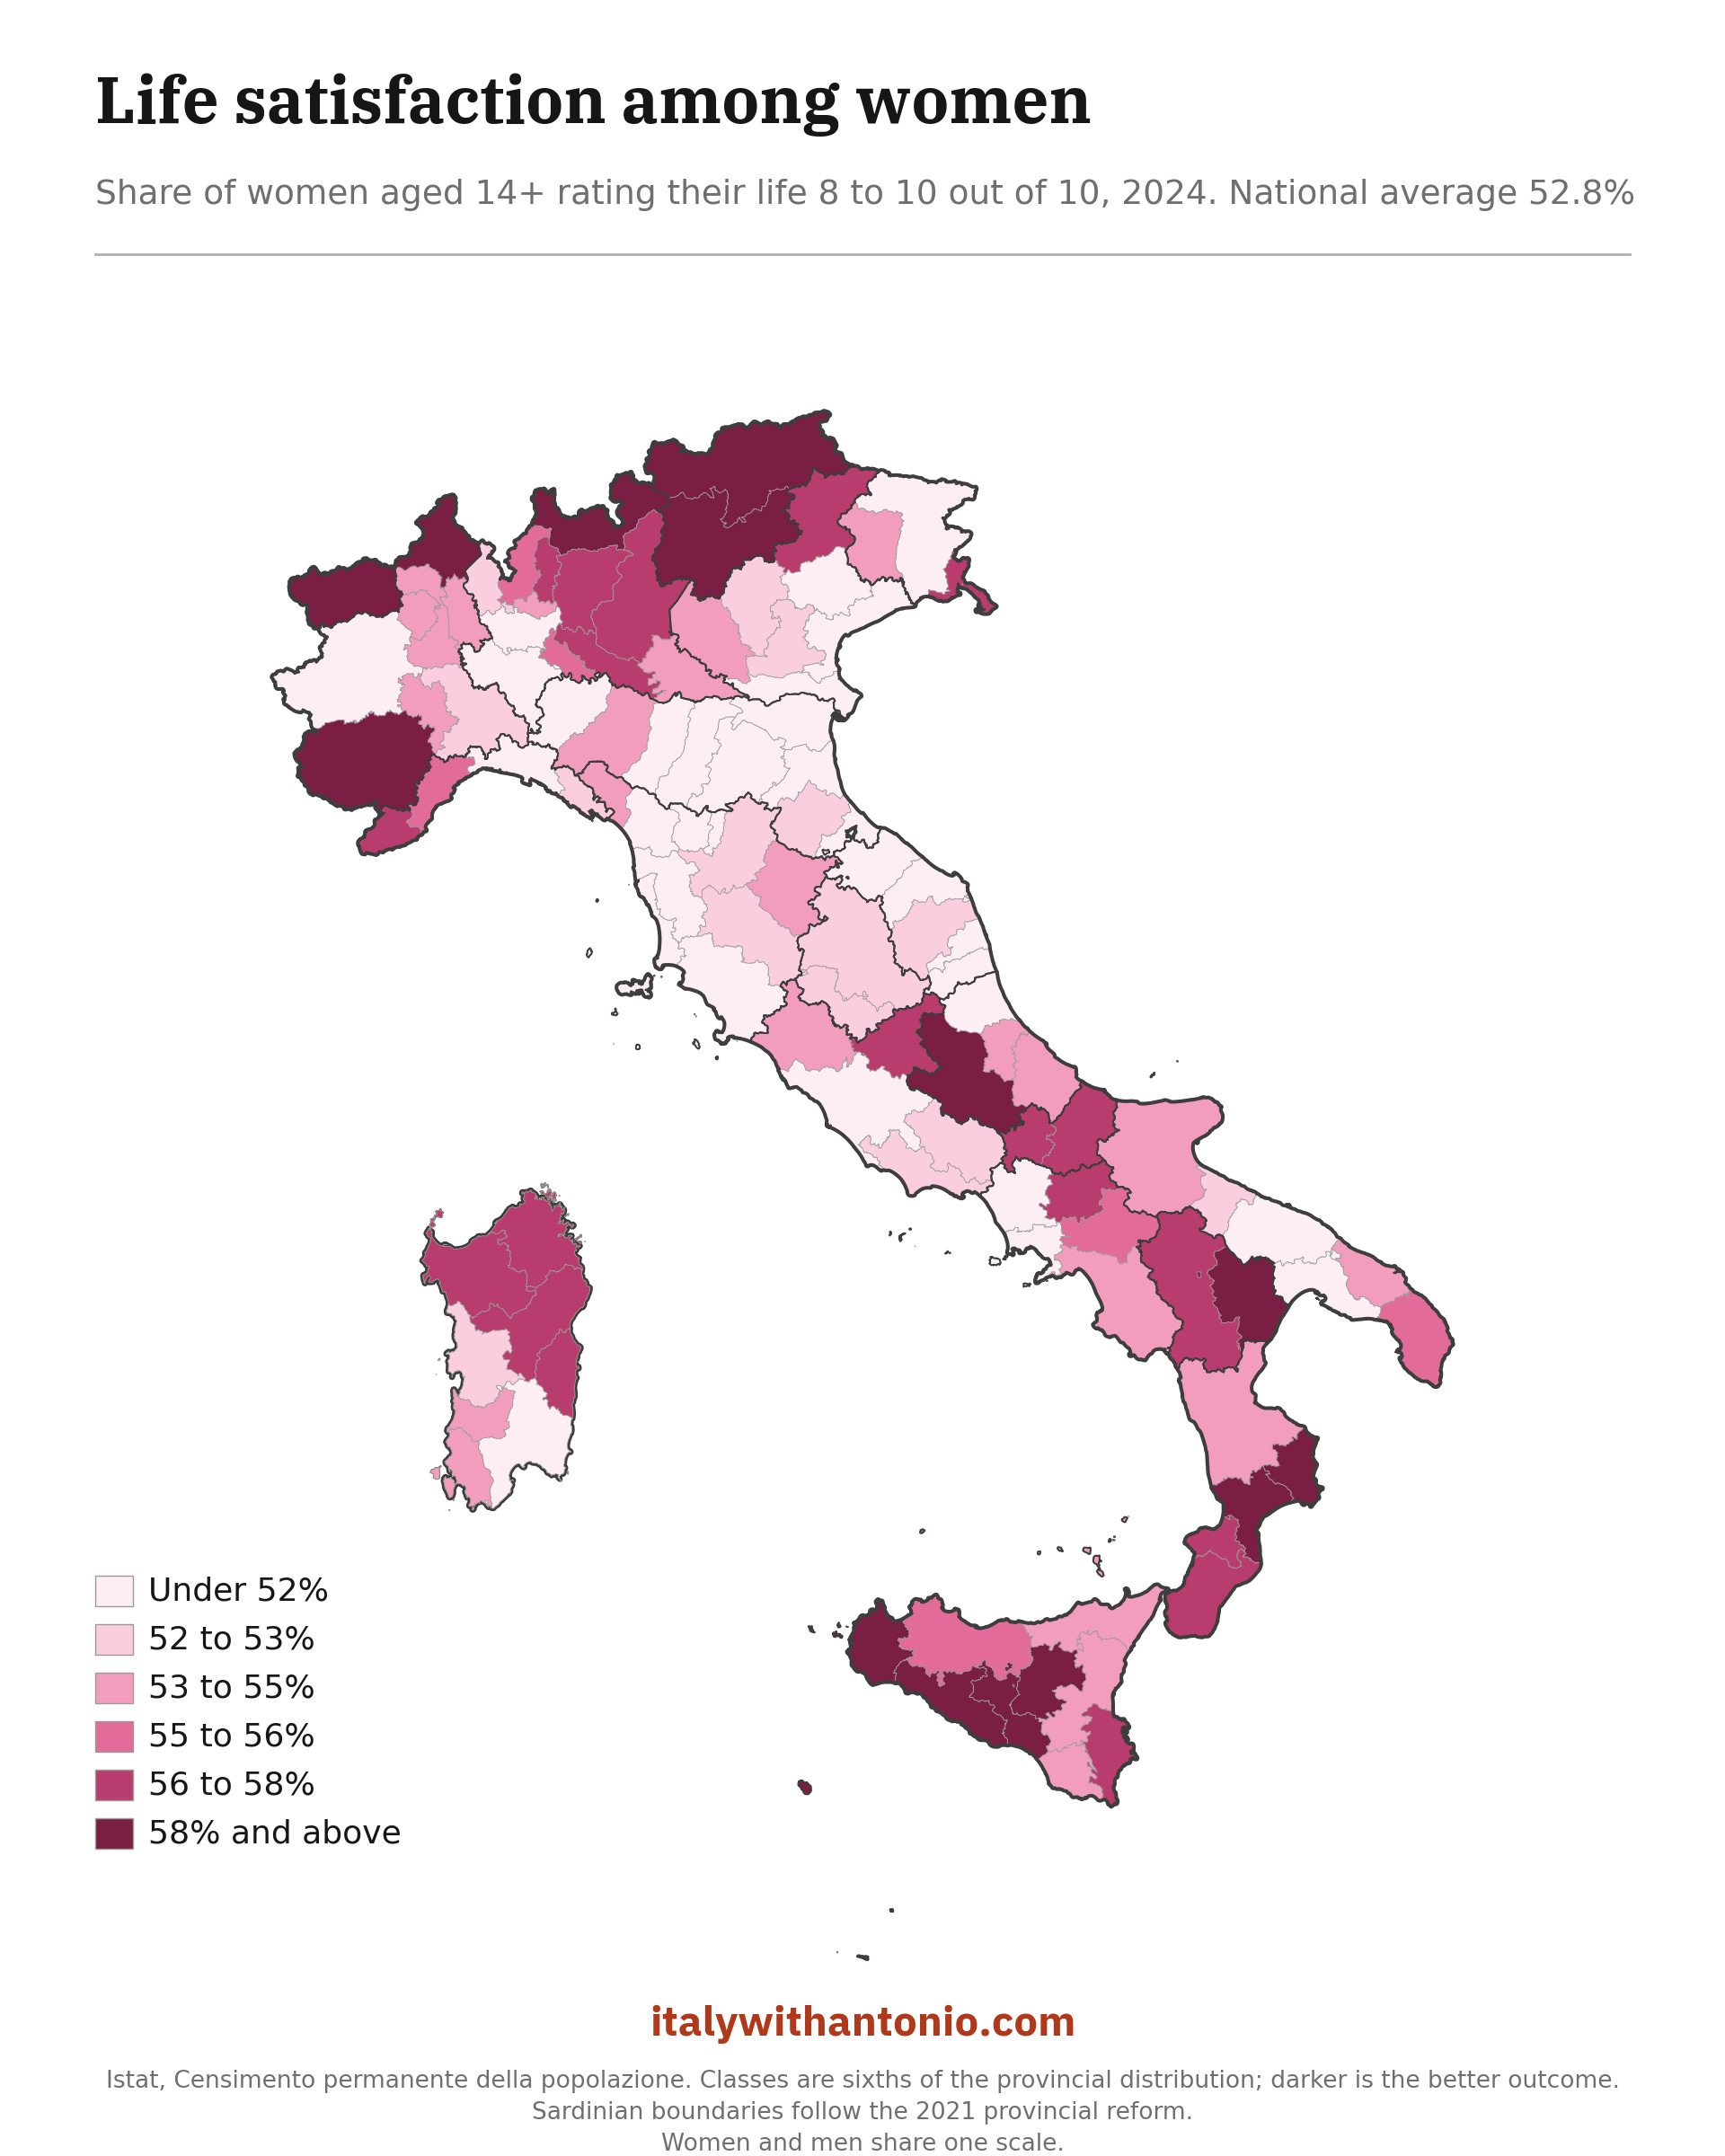
Before I pull any numbers, it’s pretty obvious from the maps that men have higher life satisfaction than women in Italy. The men’s map has far more dark areas.
Specifically, 55.0% of men reported a high life satisfaction versus 52.8% of women. A small gap, but a gap nevertheless. In only 2 of 107 provinces, women are happier than men: Ragusa (in Sicily) by a margin of 1.4 points and Barletta-Andria-Trani (in Apulia) by a statistically insignificant margin (i.e., 0.03). Matera is effectively a draw. All other 104 provinces go to the men.
The provinces where the gap is most in favor of men are Genoa in Liguria (+4.1), Ascoli Piceno in Marche (+3.9), Lucca in Tuscany, La Spezia in Liguria, and Siena in Tuscany (all at +3.8). Rich, center-north provinces, not the poor south, as we might have conjectured.
The family, friends, and neighbors maps
Next, let’s take a look at social network support (you know, the offline kind). Respondents on the census were asked if they have relatives to rely on in case of need.
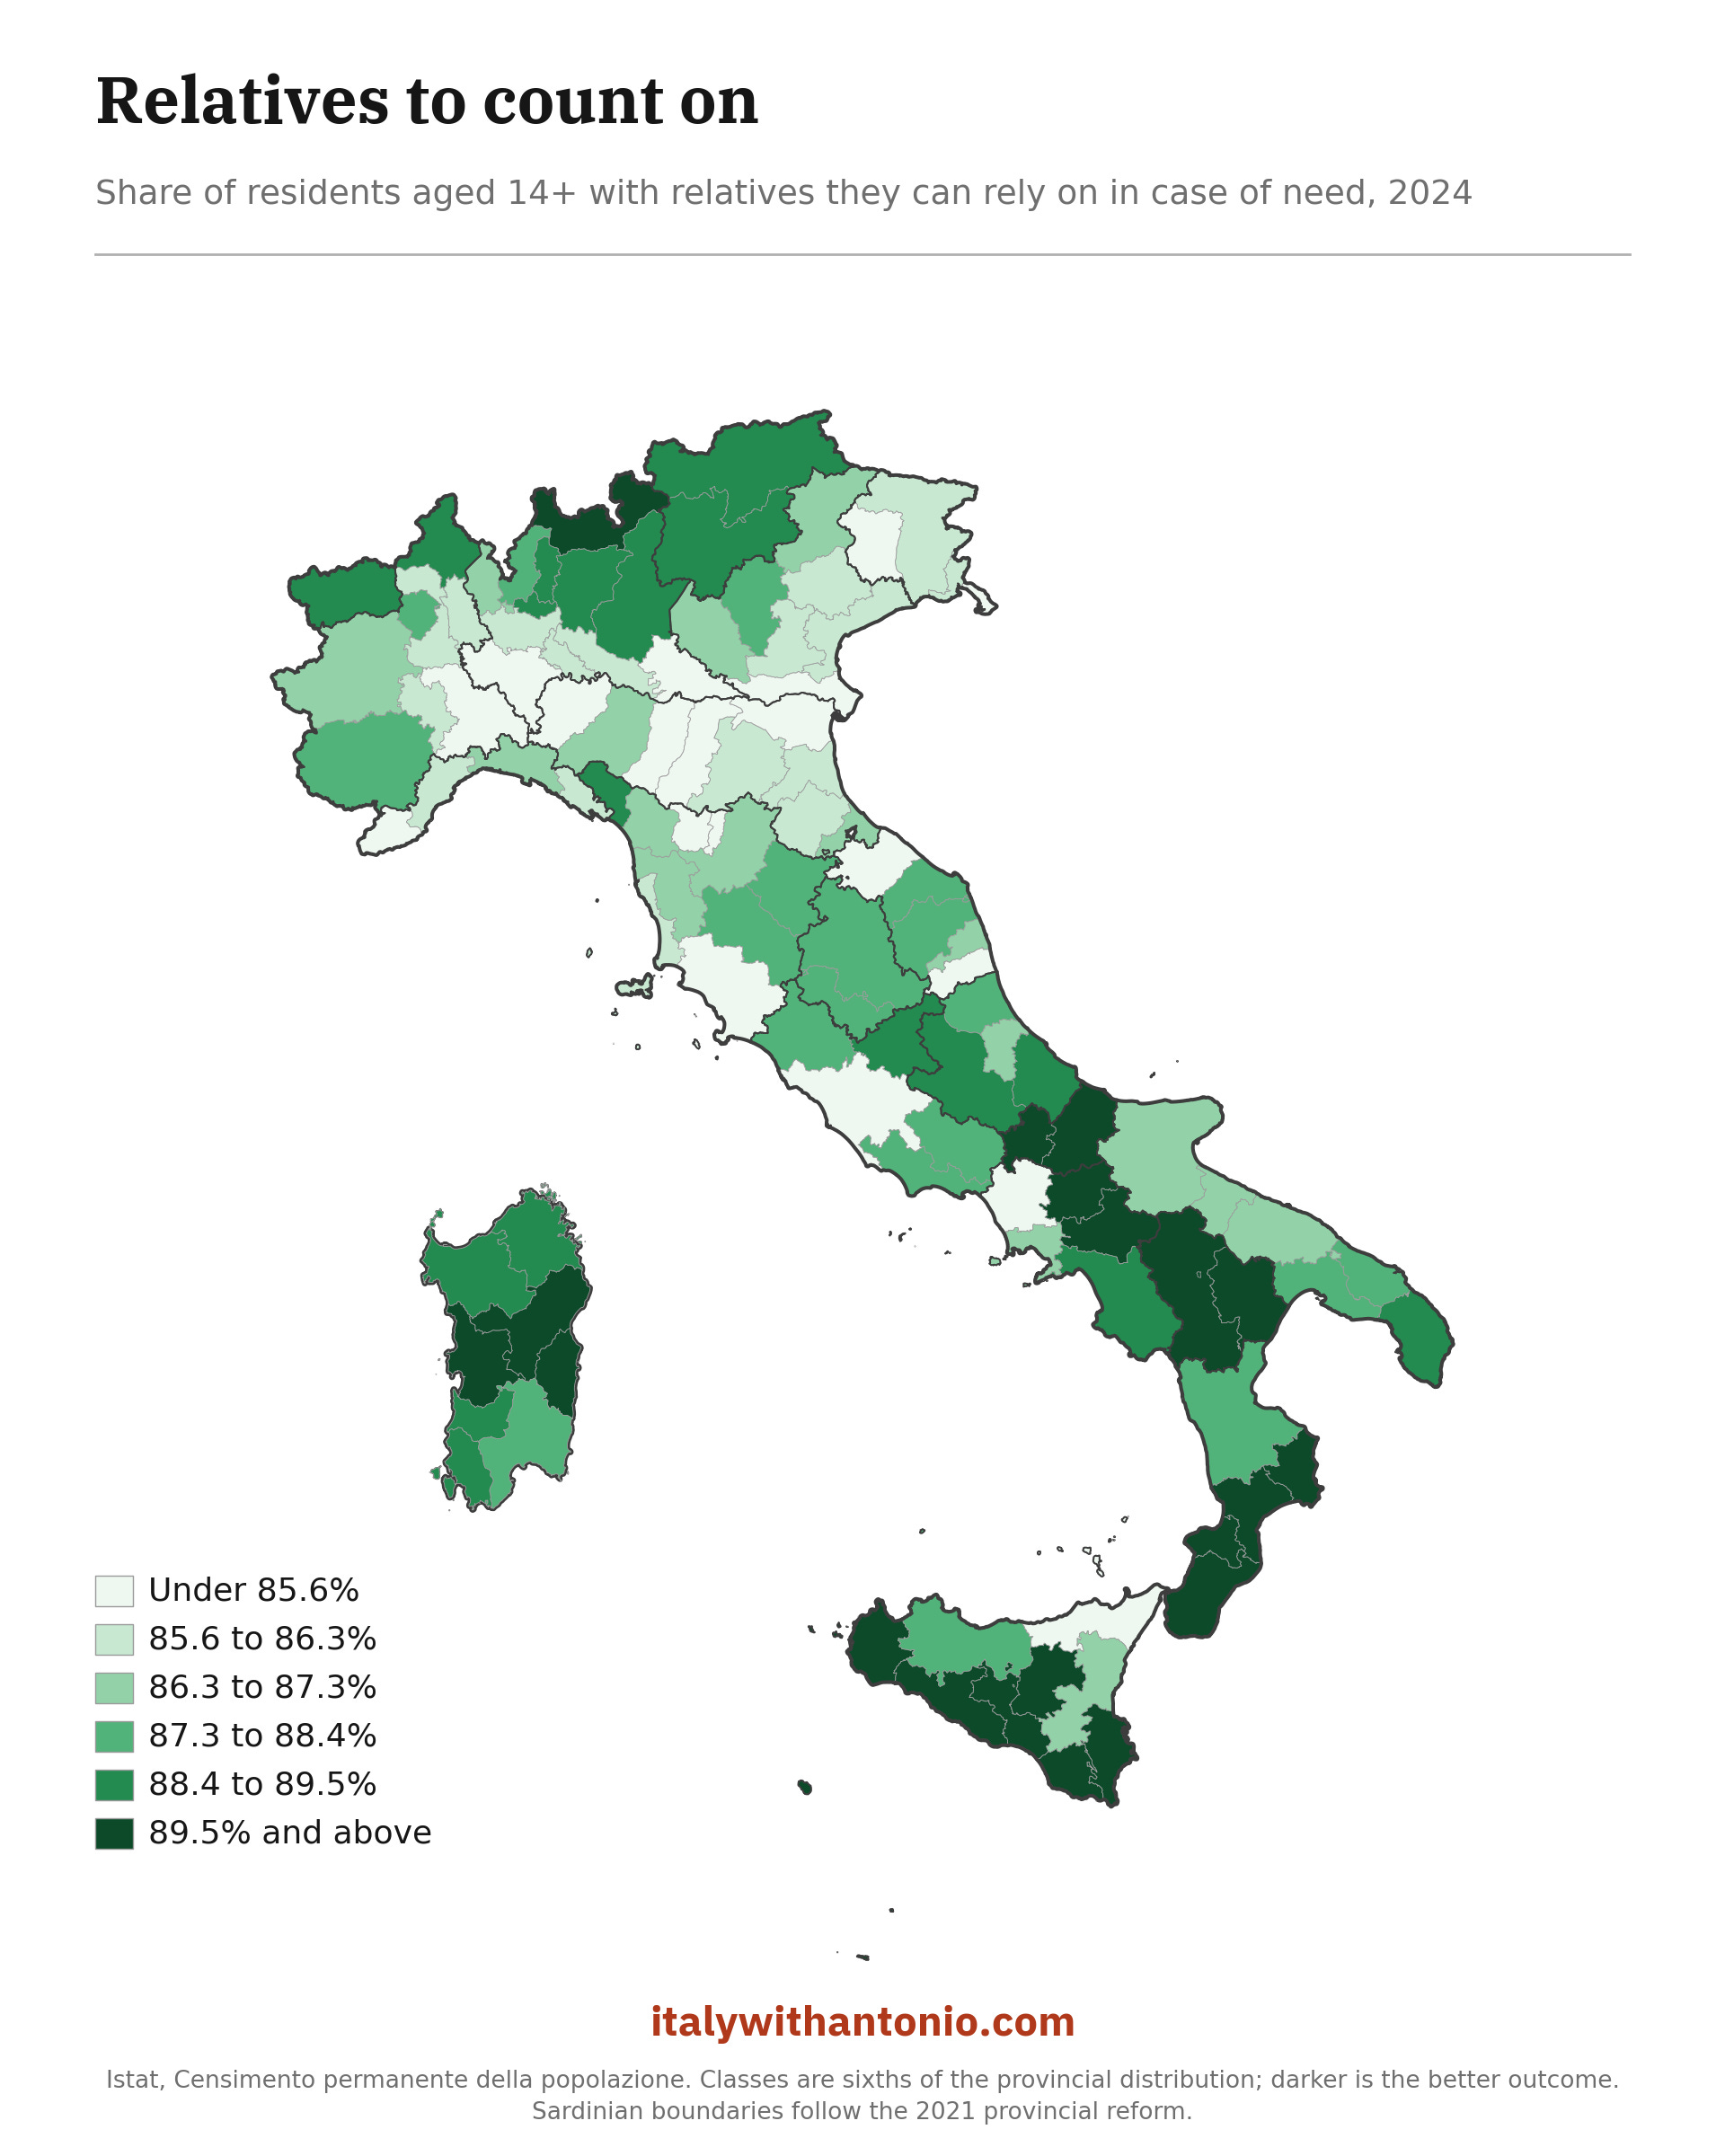
Aside from Caserta in Campania and Messina in Sicily, the south absolutely dominates on this metric, validating the stereotypes.
The national record (93.6%) belongs to Crotone (in Calabria), one of the poorest provinces in the country.
After family, let’s look at friends.
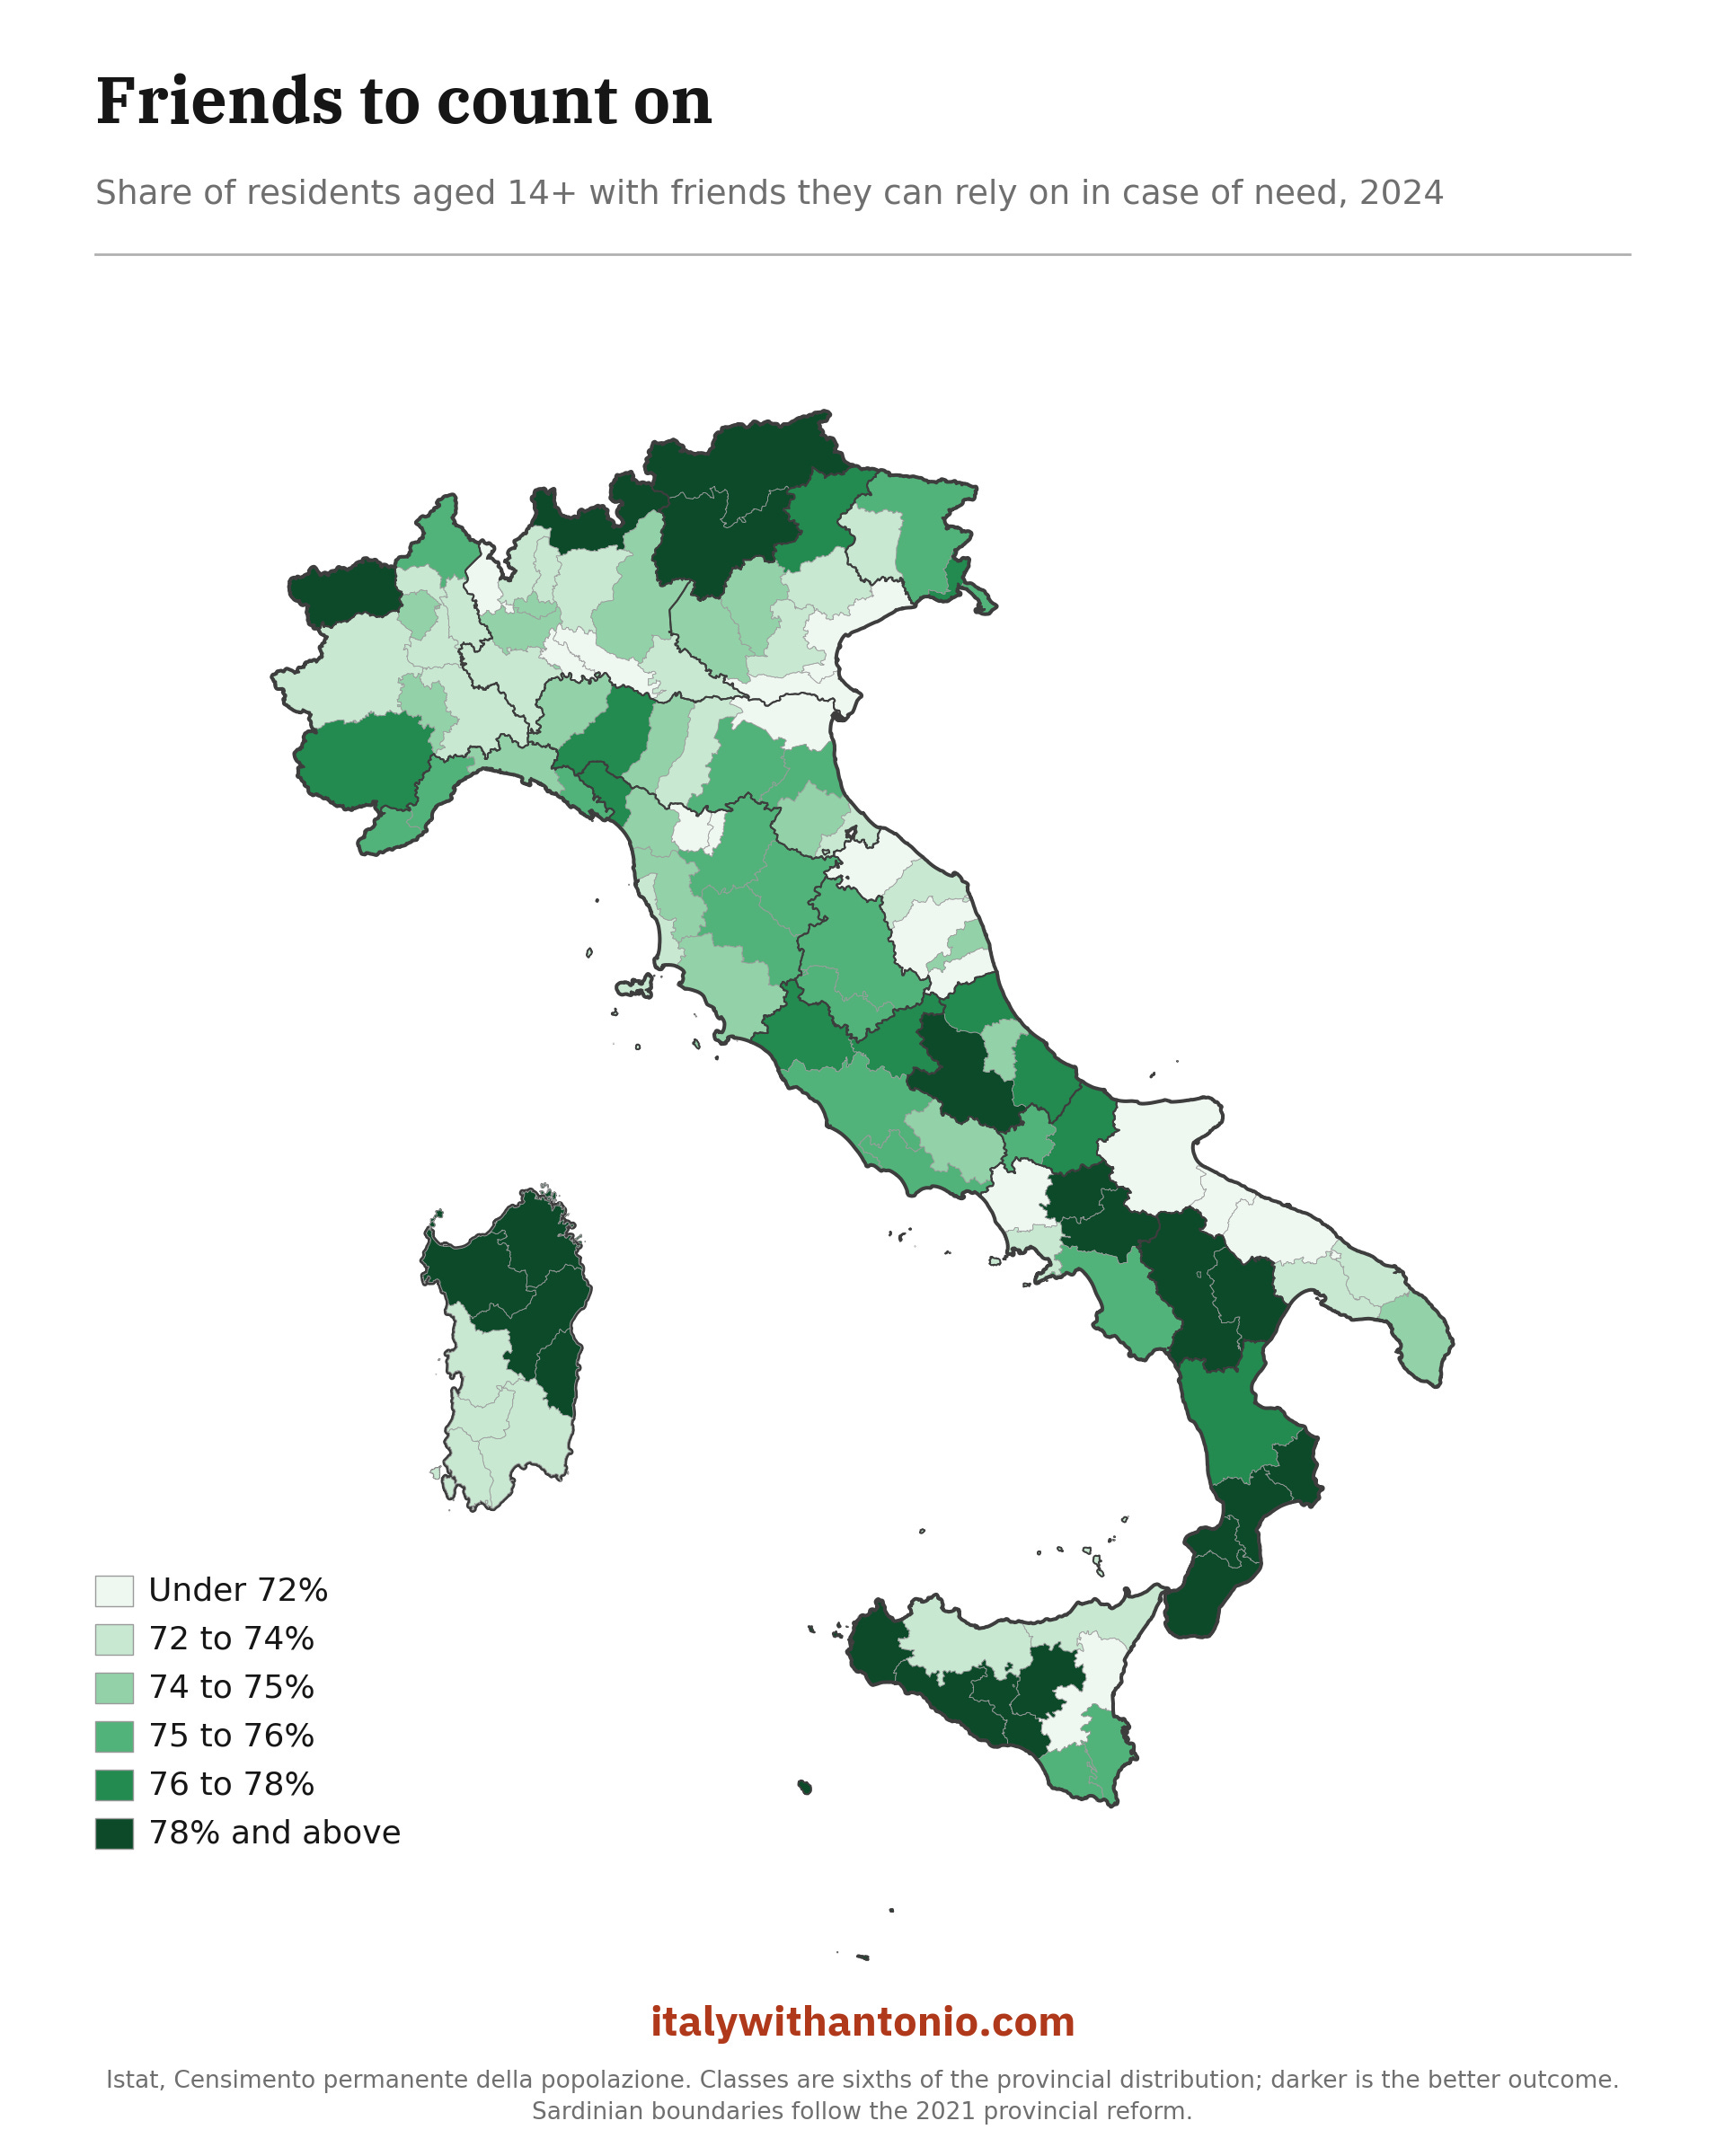
The split north-south doesn’t materially change. At the top of the chart, we have Nuoro in Sardinia (84.3%), and at the bottom we find Rovigo in Veneto (67.2%).
Finally, let’s look at the percentage of people who can rely on neighbors.
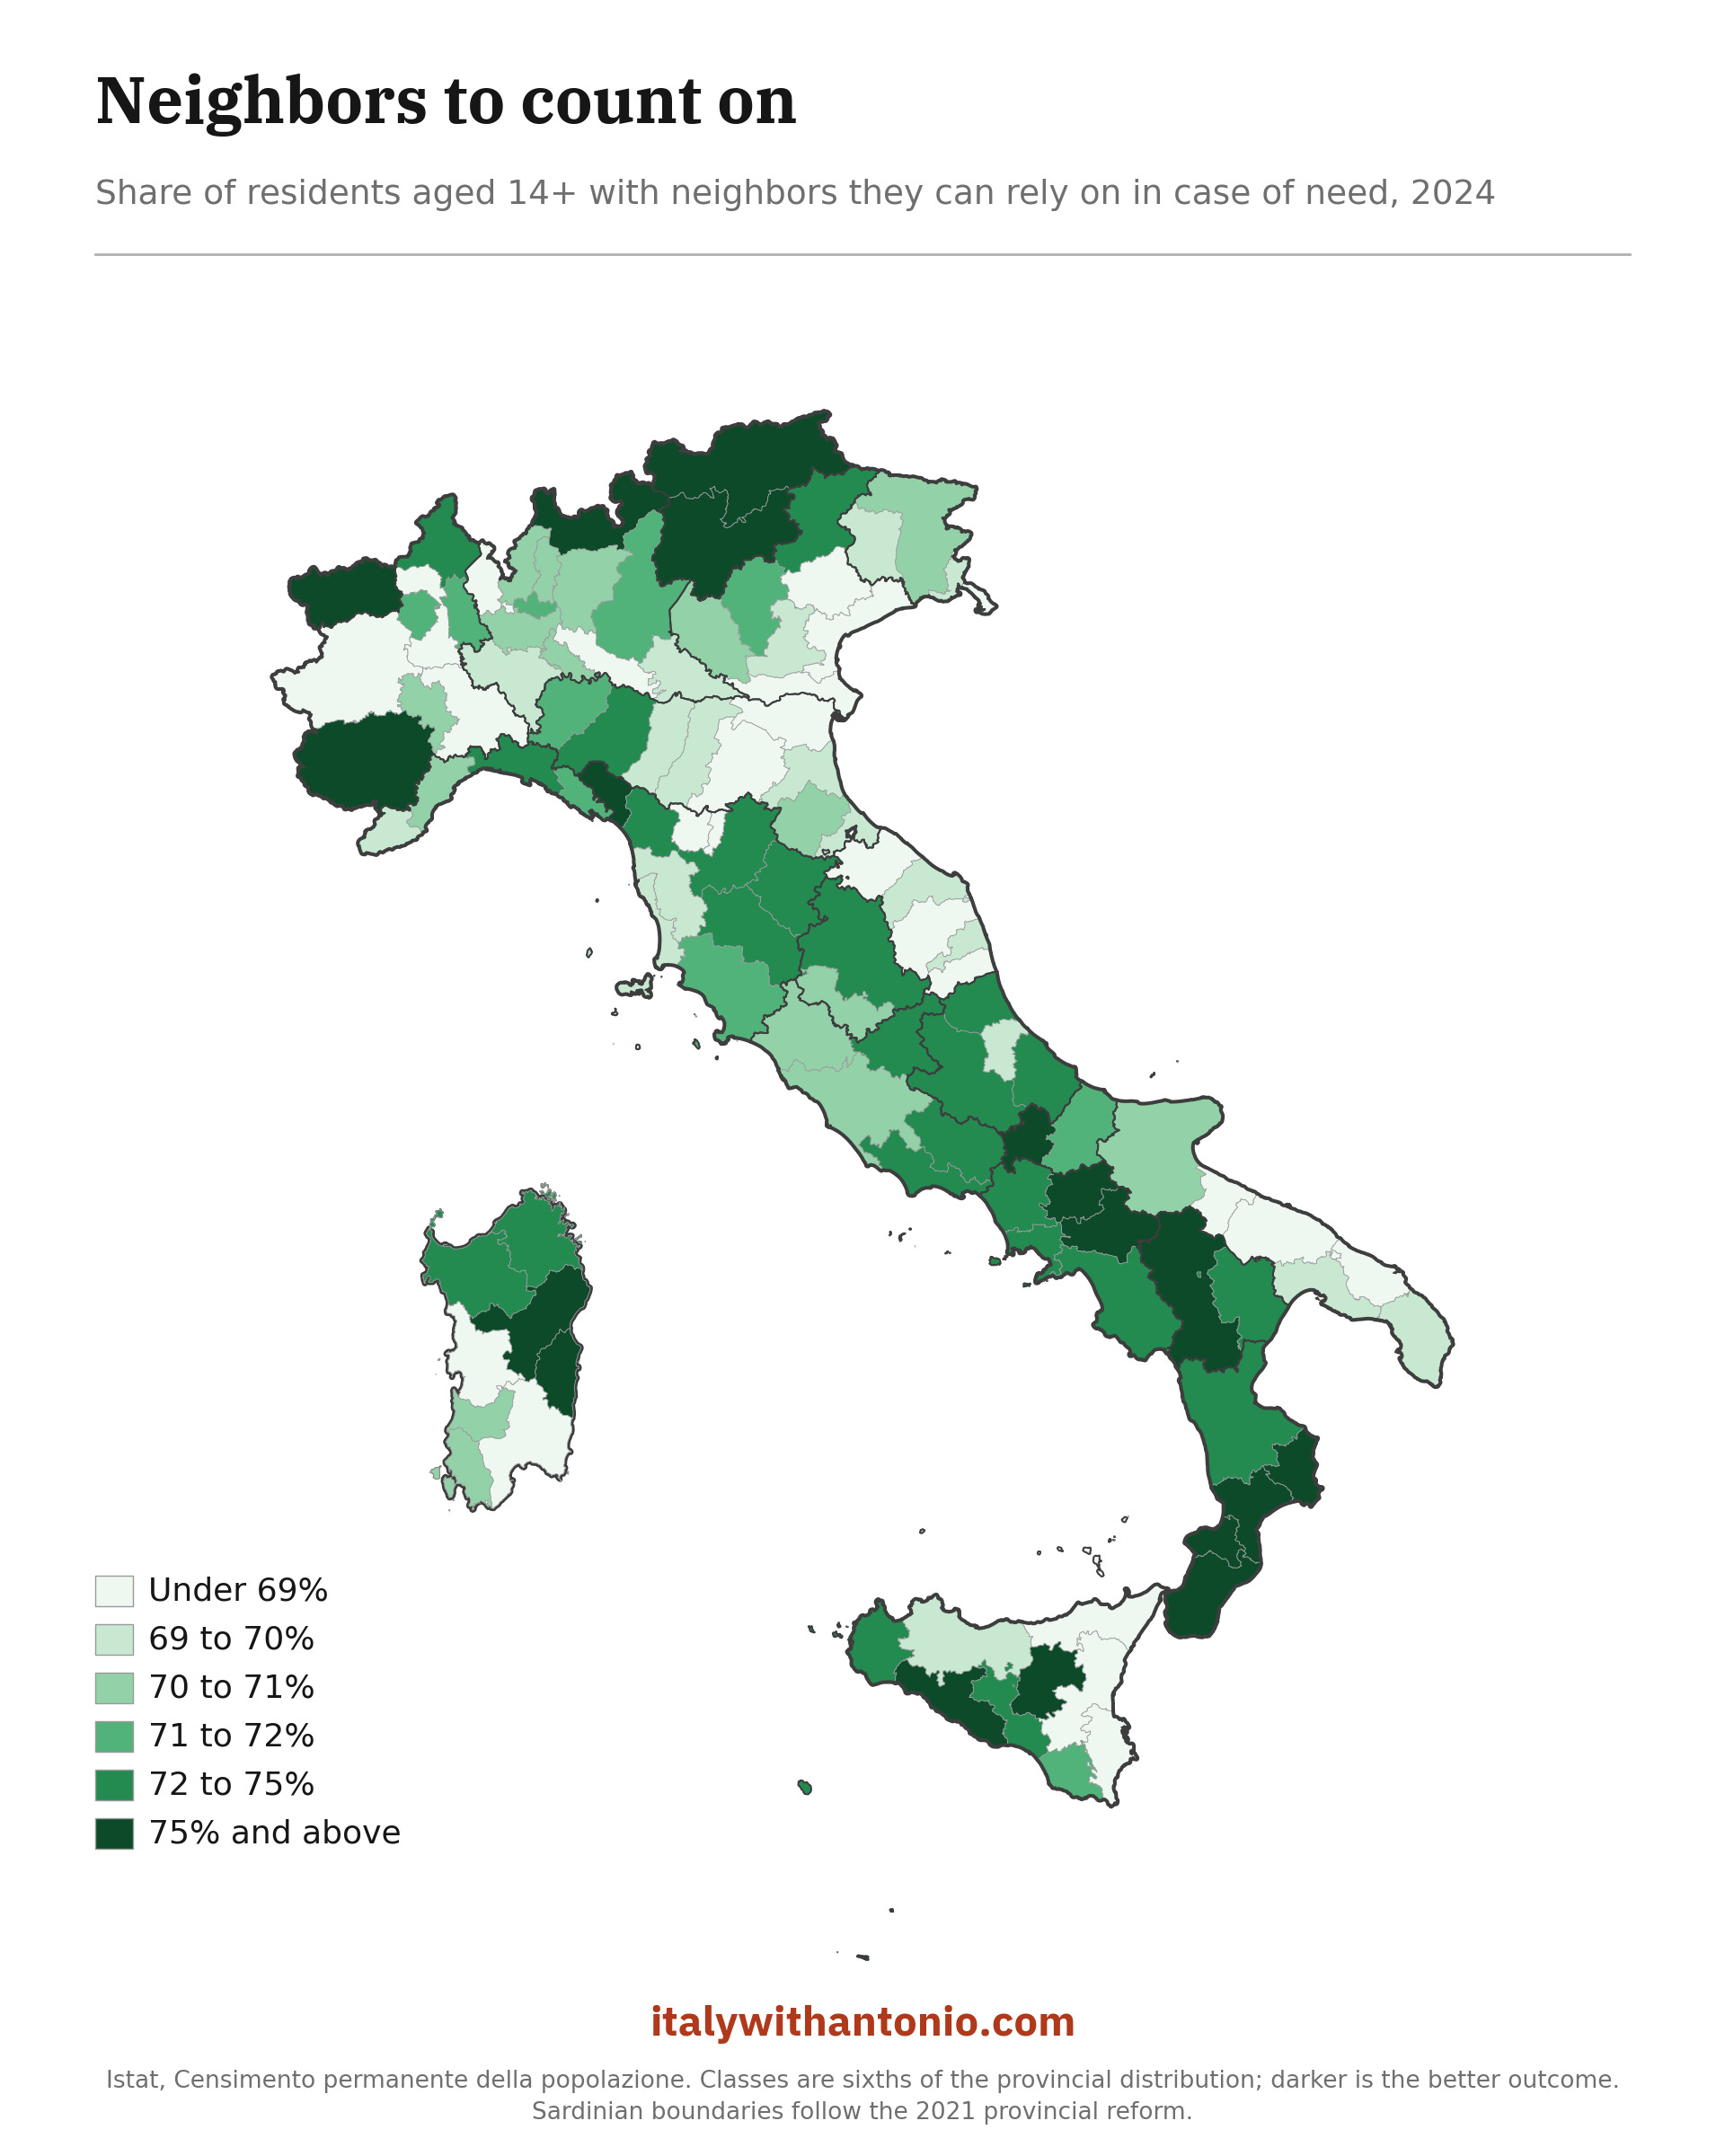
Crotone is at the top again (84.1%), and Rovigo is once again dead last (62.3%). The south continues to have a strong performance on social connections, but it’s clearly not exclusive to them, as shown by the Alpine provinces.
Crime and safety perception
It’s hard to be happy or at peace if you’re scared for your life. So the next two maps are about crime in Italy. Not objective crime, which I already mapped before, but rather the perception of crime and safety.
This is the map of the percentage of people who feel safe walking alone at night.
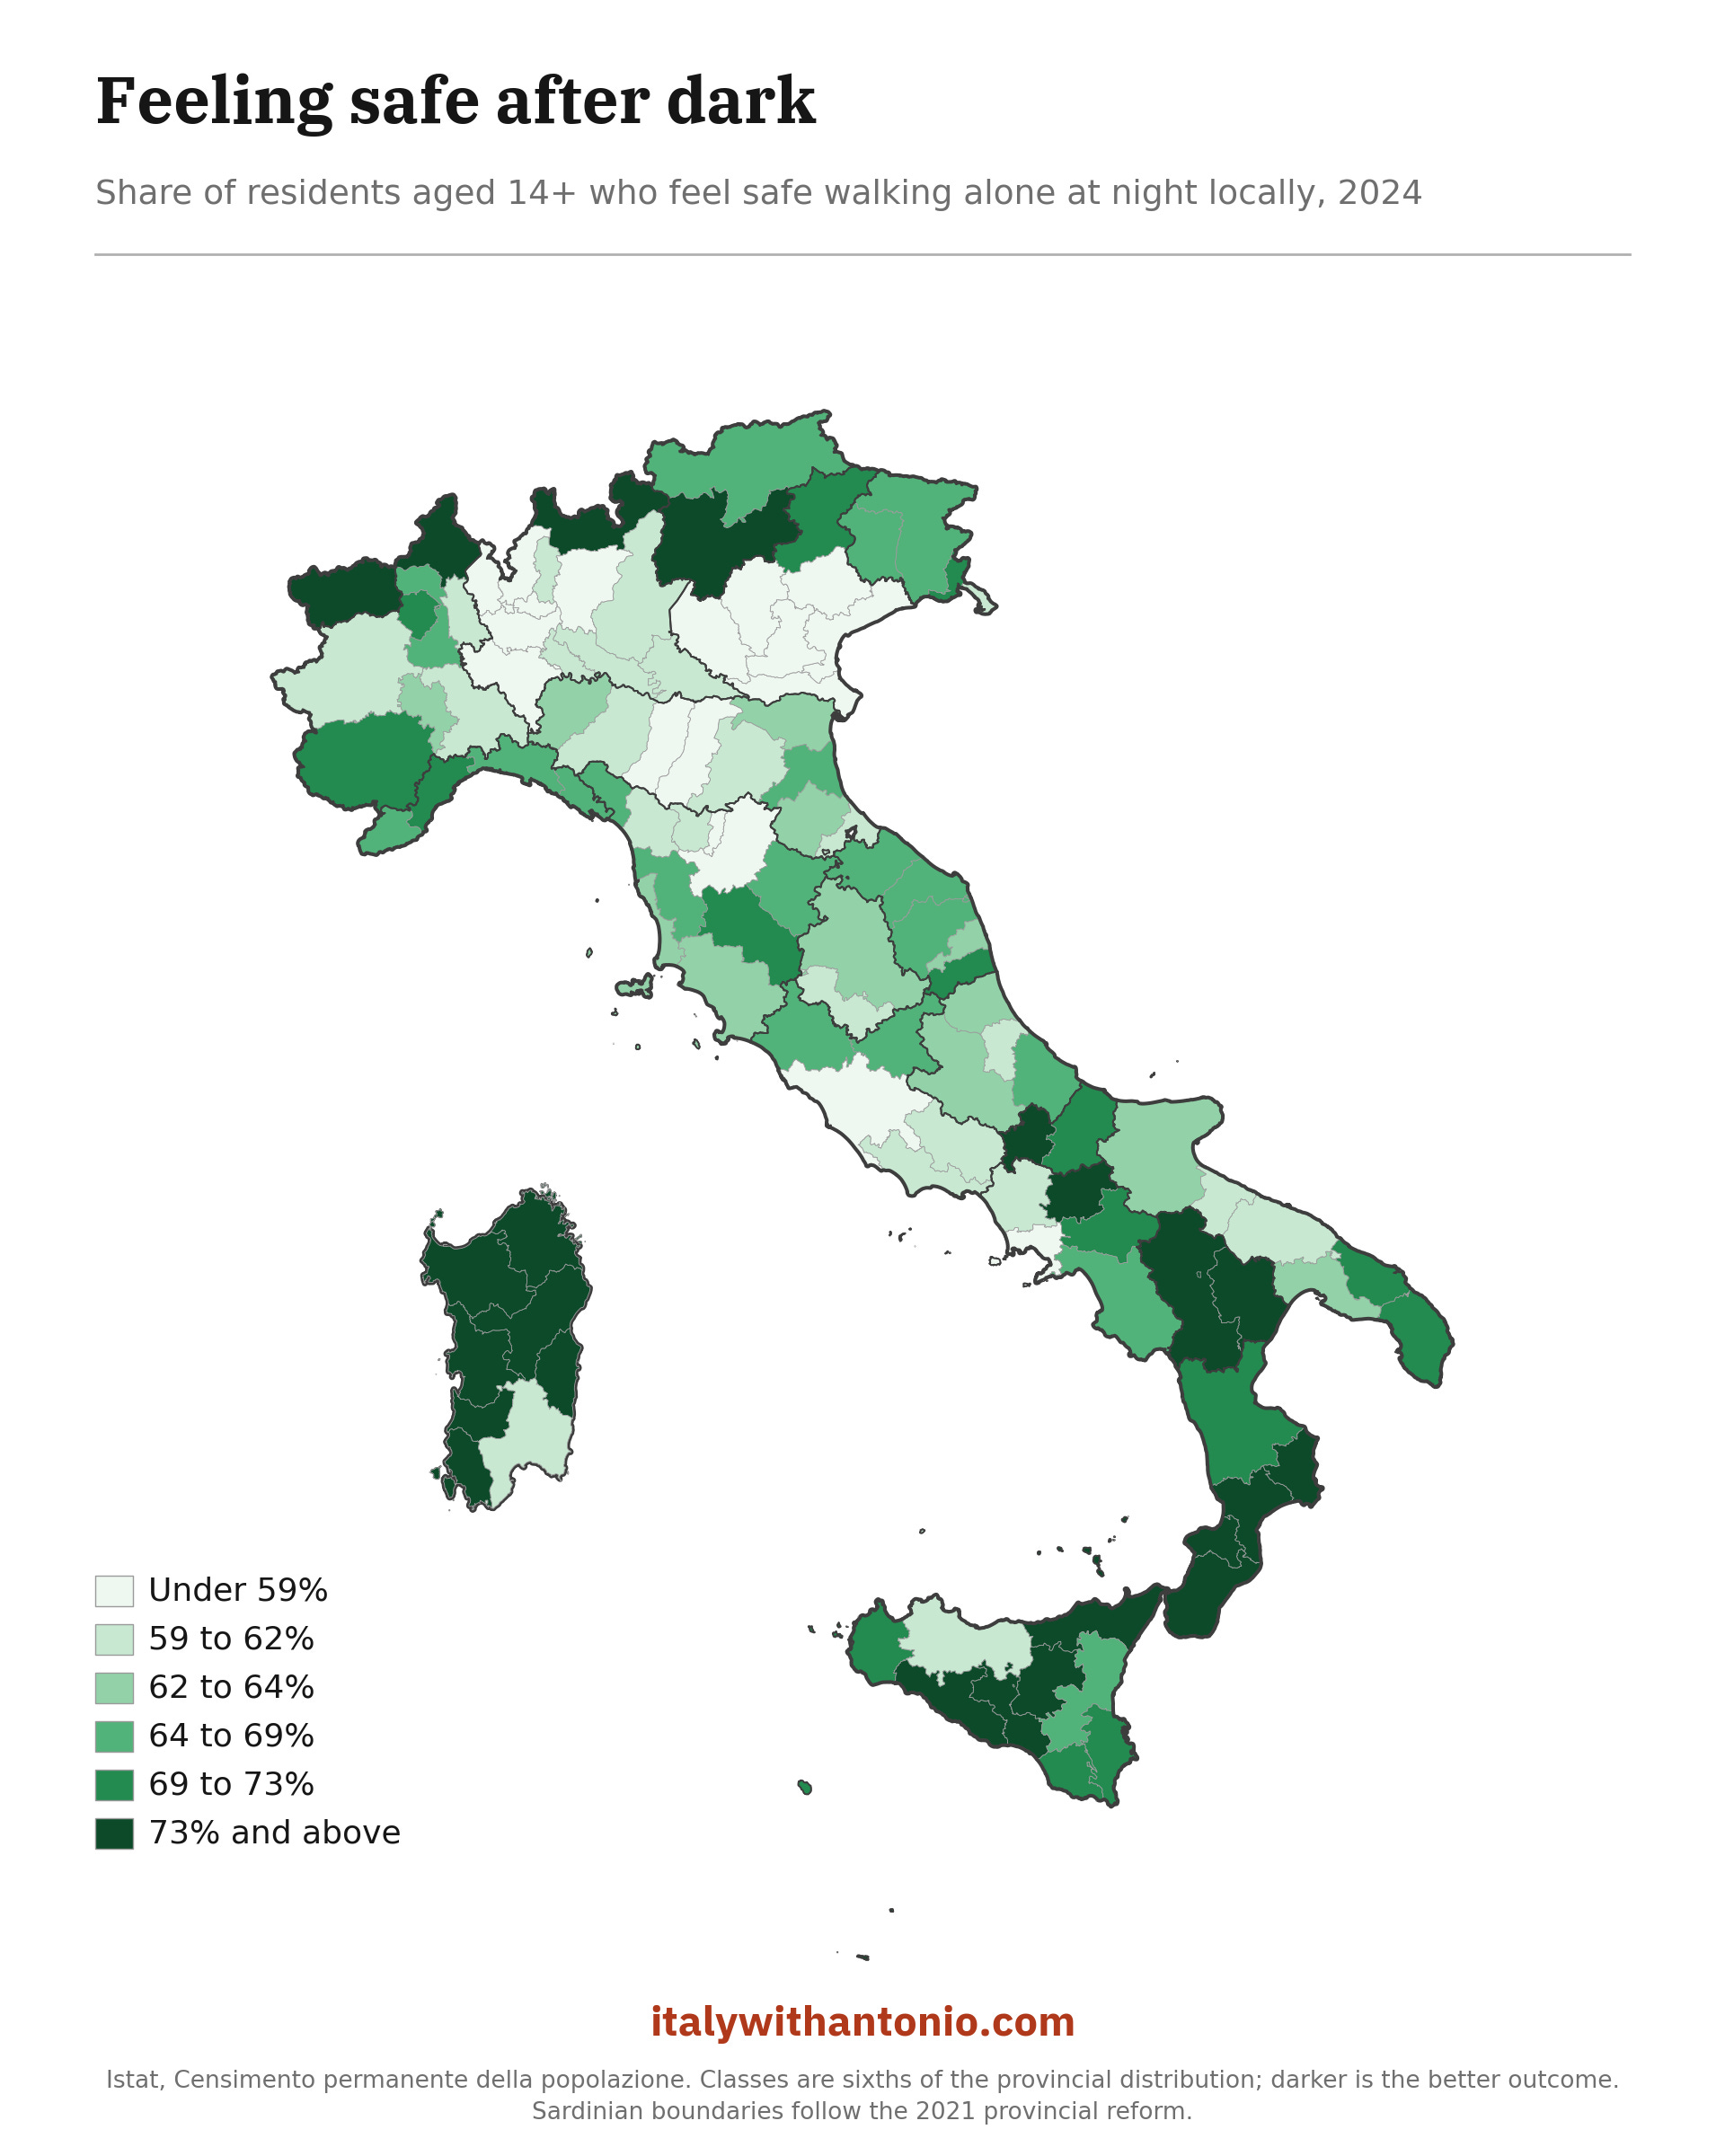
Again, the south (Sardinia very much included) and the Alpine provinces are standouts.
In fact:
Best: Enna 85.0%. Then Sondrio 80.2%, Crotone 79.6%, Valle d’Aosta 79.4%, Nuoro 79.4%.
Worst: Prato 47.9%. Then Milan 49.6%, Verona 51.4%, Monza e Brianza 52.7%, Rome 52.7%.
Sadly, the gender gap is massive here. At the national level, 72.4% of men feel safe walking alone after dark. Only 51.5% of women do. A 20.8-point gap, which is widest in the Monza e Brianza province at 28.1 points.
Next, the overall perceived crime risk. Note that in the case of this chart, lighter is better.
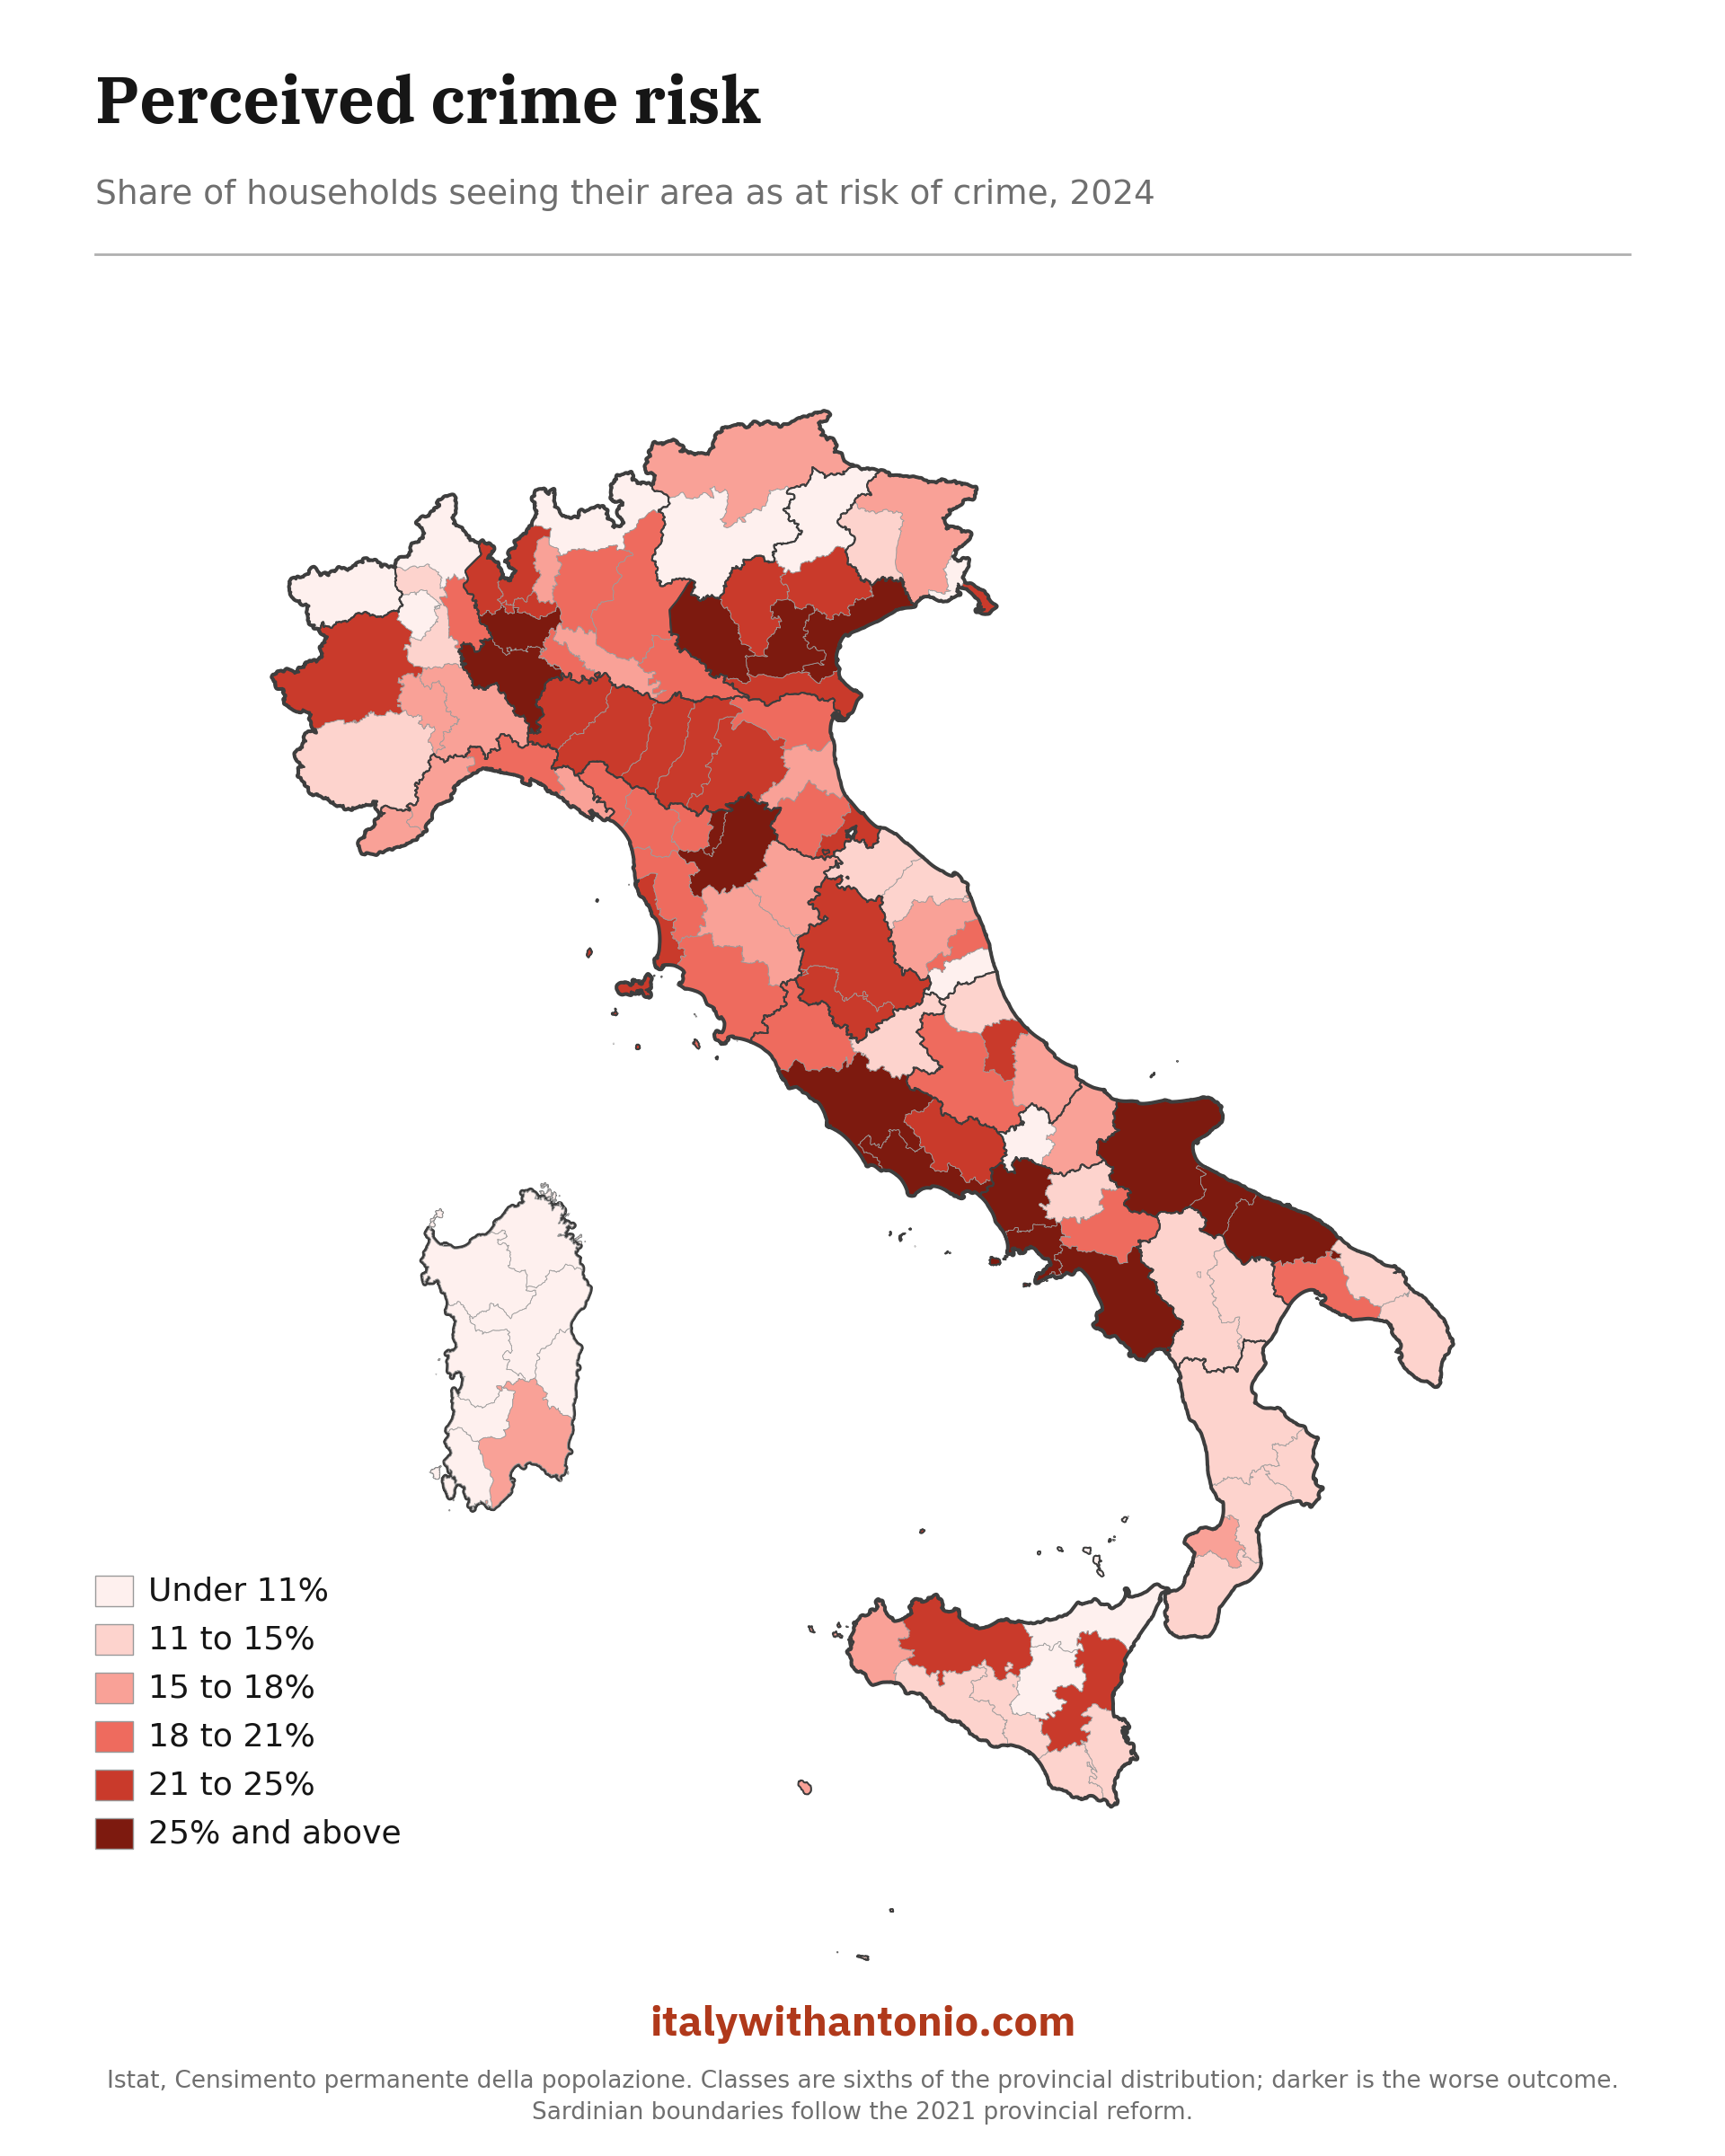
Again, Alpine areas and the south are positive standouts. However, Campania and most of Apulia are largely excluded.
Specifically:
Best, meaning least fear: Oristano 3.7%. Then Nuoro 4.8%, Sondrio 5.6%, Enna 5.7%, Valle d’Aosta 5.8%.
Worst: Naples 46.3%. Then Rome 37.1%, Milan 36.3%, Prato 36.2%, Barletta-Andria-Trani 31.5%.
Prato is an interesting anomaly. A small province in Tuscany that happens to have the worst perception of safety at night and the fourth-worst perception of crime overall.
More interesting facts
In the process of collecting and analyzing this data, I came across some interesting insights and outliers. I’m presenting them here in more or less random order.
Correlation shows how two variables move together. For example, how ice cream sales grow in relation to rising temperatures. We can use it here to measure the relationship between each of the five variables and the overall life satisfaction reported by each province. Correlation doesn’t imply causation, but we can still use it as an imperfect proxy of how much each of these factors affects happiness in Italy. 1 means total correlation. -1 means inverse correlation.
The correlations with life satisfaction, from best to worst, are friends (0.71), relatives (0.65), neighbors (0.62), perceived safety after dark (0.59), and fear of crime (-0.54). The inversion for the last indicator is normal since we are not measuring a positive, but rather a negative. The more crime you fear, the less happy you are.
Interestingly, friends beat family when it comes to affecting happiness, something intuitive in my experience, but still contrary to the Italian stereotype. (I realize, taken out of context, “friends beat family” sounds like a local newspaper headline.)
Looking at the extremes of the overall life satisfaction data, we find that the places with the most 10-out-of-10 responders are: Enna (24.2%), Vibo Valentia (21.2%), Nuoro (20.6%), and Agrigento (19.5%). The worst provinces for this are Bologna and Ravenna at 9.3%. People in Emilia Romagna are surprisingly unenthusiastic.
In terms of people scoring their happiness 5 or below, Cagliari (14.7%), Genoa (14.3%) and Ferrara (14.1%) take the podium for having the most negative Nancys.
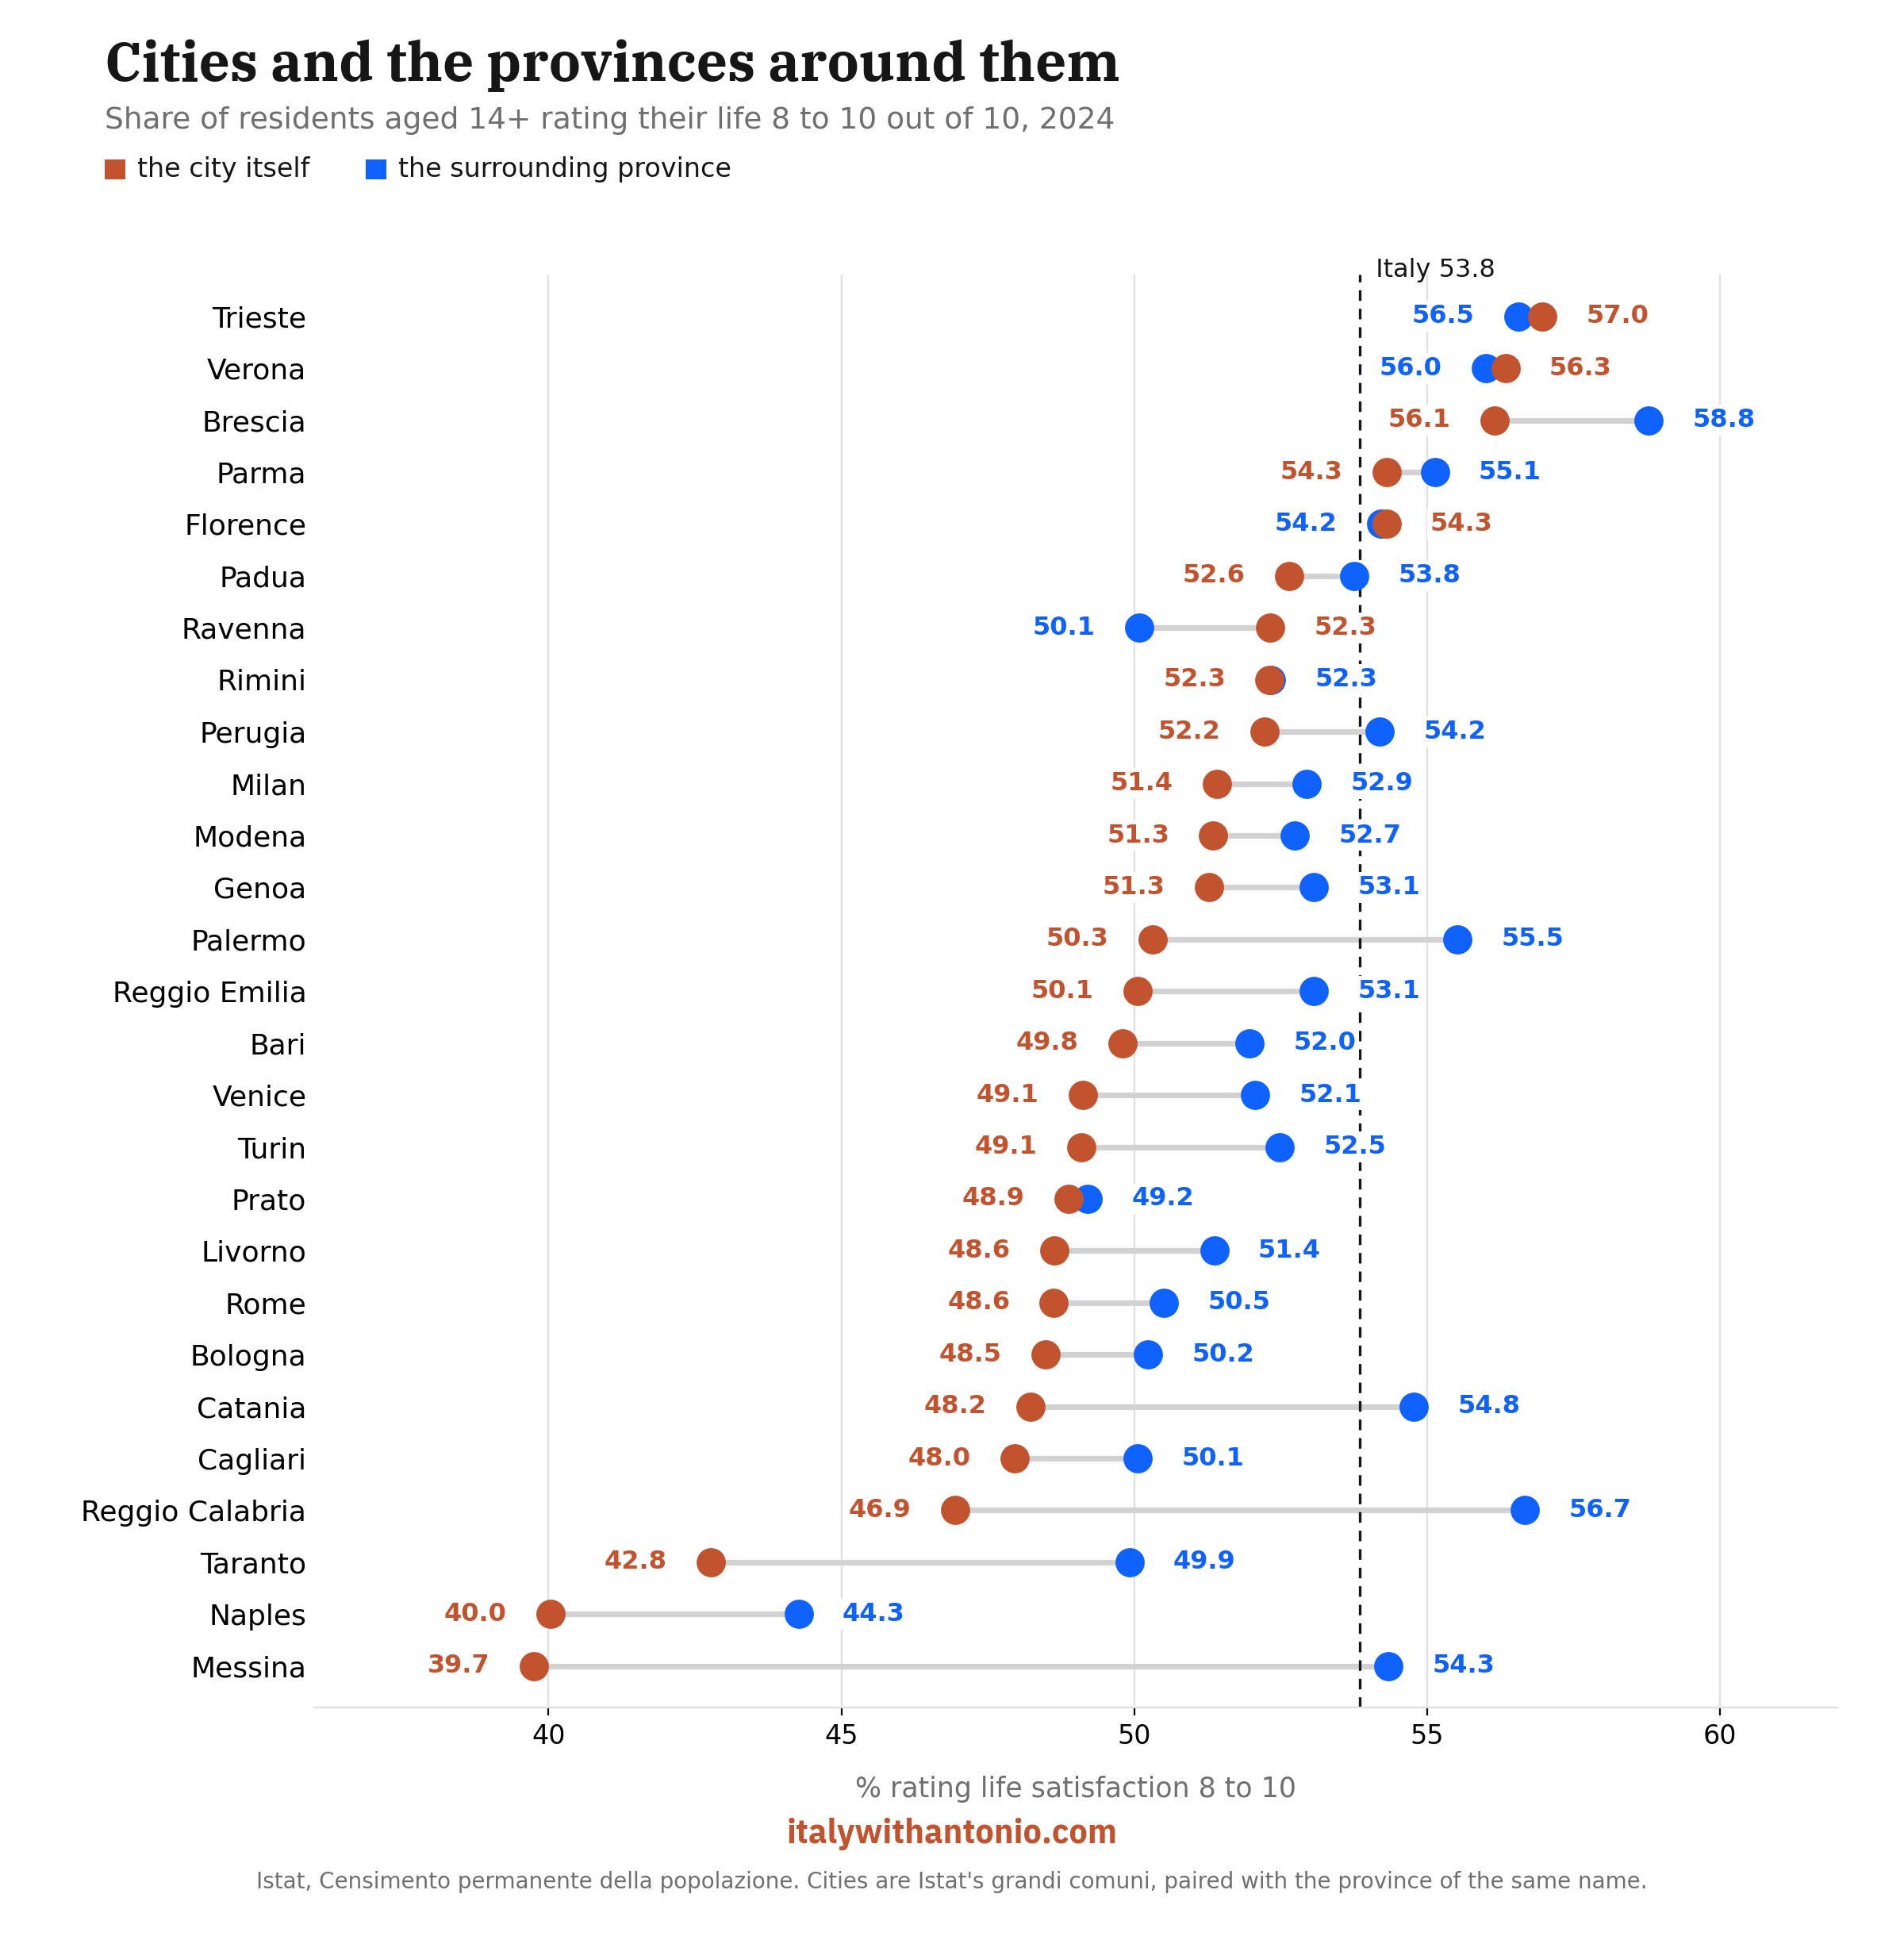
On average, people living in a province tend to be happier than those living in the capoluogo (the capital city) of that province. For example, Turin’s city is at 49.1% on the life satisfaction indicator compared with 52.5% for its own province.
All grandi comuni (big municipalities) are charted below. As you can see, 23 out of 27 have the province outperforming the city.
Interestingly, women report more support than men on two of the three social maps. Yet, despite being better connected, they are less satisfied. Perhaps because of their much worse view of crime. Or because they are slightly behind on the friends one, which strongly correlates with overall happiness.
Finally, I noticed some outliers in terms of shifts from the 2022 data. The biggest improvers in terms of happiness are Isernia (+7.3), Salerno (+6.3), Avellino (+6.1), Trapani (+5.7), and Catanzaro (+5.5). All in the south!
The provinces with the biggest drop were Grosseto (−3.1), Ragusa (−2.9), and Caserta (−1.8).
Only 13 of 107 provinces went down at all. Italy is getting happier almost across the board. Grosseto and Ragusa fell the furthest, but both started above the national average, so they regressed to the mean rather than sinking further.
Caserta is the real exception. It was already the second-worst province for life satisfaction, and it dropped further.
So, what does this mean for you?
If you plan to visit Italy, this has essentially no impact on you. But if you plan to move there, you should at least consider these maps.
You know yourself best and what you value the most, but moving to a province where people are generally happier than average has its benefits.
Or maybe you had a traumatic experience in the past, and moving to a place where people feel safe at night is a better indicator than overall reported happiness.
I give you the data and the fun facts; you do what you will with it. Ambasciator non porta pena (don’t shoot the messenger).
Sources and credits
Map data are credited on each image. Administrative boundaries are Istat’s, obtained via openpolis/geojson-italy and released under CC BY 4.0. Comune population and code lookups come from Open Data Sicilia’s comuni-italiani. Maps built in Python by me. All analysis, classification, and errors are mine.
This is SO interesting!! Grazie mille per il tuo lavoro! I'm sharing with my husband and friends - Our home is in Selinunte. Your data seems to echo what we've intuited. Evviva!
I really liked this story, I’m going to have to read more of your articles. Thanks for sharing.